Processors
- AMD Community
- Support Forums
- Processors
- Re: Ryzen 9 5950x running very hot 74C
- Subscribe to RSS Feed
- Mark Topic as New
- Mark Topic as Read
- Float this Topic for Current User
- Bookmark
- Subscribe
- Mute
- Printer Friendly Page
- Mark as New
- Bookmark
- Subscribe
- Mute
- Subscribe to RSS Feed
- Permalink
- Report Inappropriate Content
Ryzen 9 5950x Running at 74c, Is this a safe Temperature?
I have paired a new Ryzen 9 5950x with an Asus Crosshair viii hero, but I am suffering really high temperatures. at idle the processor is running at 75C. Under very light load goes up to 80C
I have tried lot of things and just for clarity I am very experienced in building machines (over 25 years).
I used a Corsair 100i platinum cooler and after several attempts to cool ( 4 reseats using 3 different CPU thermal pastes) I came initially to the conclusion it was the cooler at fault.
Wanting to use I bit the bullet and bought a replacement cooler a Kraken X73, I installed and net result was 1C cooler i.e. 74C. So not the cooler but something else!
I did some searching online to discover others have been having a similar issue multiple motherboards, I found some suggestions to help which were to switch my board into an eco mode (which did nothing) the next suggestion was to disable boosting (which kind of cripples the chip) , this I did and now see temperatures in the region of 45C. I don't know where the problem lies exactly, but if several manufactures are seeing then it kind of points to an AMD issue with the Chip or something they have supplied to the board manufacturers. After days of building and then re-applying the coolers I do feel a little cheated. I tried raising with ASUS but because I registered my motherboard for cash back it is saying the serial number is already registered so cannot raise a support case. I coming on here hoping that someone can give some advice and maybe someone from AMD can help.
- Mark as New
- Bookmark
- Subscribe
- Mute
- Subscribe to RSS Feed
- Permalink
- Report Inappropriate Content
The EDC is the max momentary burst/boost current. TDC is the max sustained current. Which is why I pointed out that it is strange that your motherboards PBO settings had TDC higher than EDC.
Hitting 100% on EDC and TDC is not strange, in fact, that is probably expected behavior when the two are only 20A apart. EDC at 100% means that in a given workload, the VRMs are occasionally employing that amperage, but that should never be a limiter on your sustained performance. Now what happens if the EDC is actually set lower than the TDC is anyone's guess. The EDC should be set at the absolute limits of the VRMs, such that any amperage supplied at that level is temporary. If the TDC is set even higher, then that could cause permanent damage to the VRMs. The question is if TDC is set higher, is that the real limit of the VRMs? Does the motherboard ignore EDC if it is lower than TDC? Not sure what ASUS is doing there.
In any event, precision boost, should keep boosting until it hits either the TDC, PPT or a temperature limit. It will also stop at a certain voltage due to limits imposed by the silicon fitness monitoring feature (FIT).
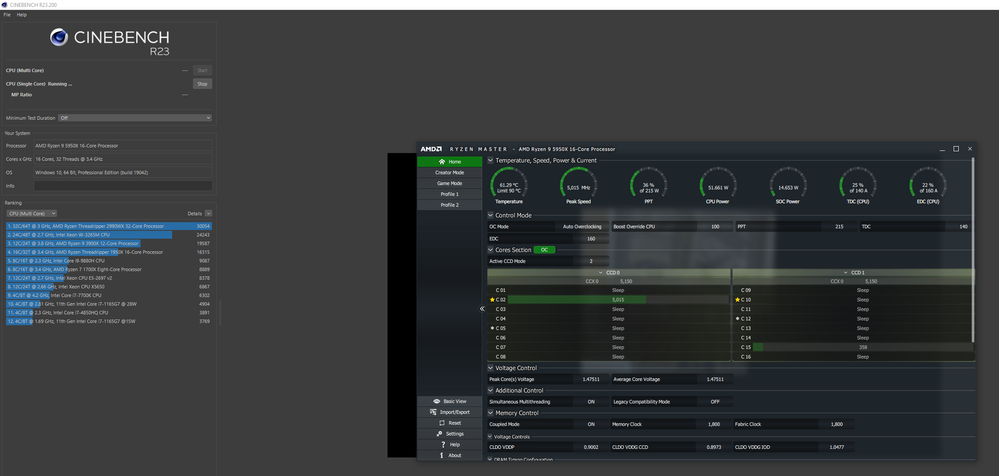
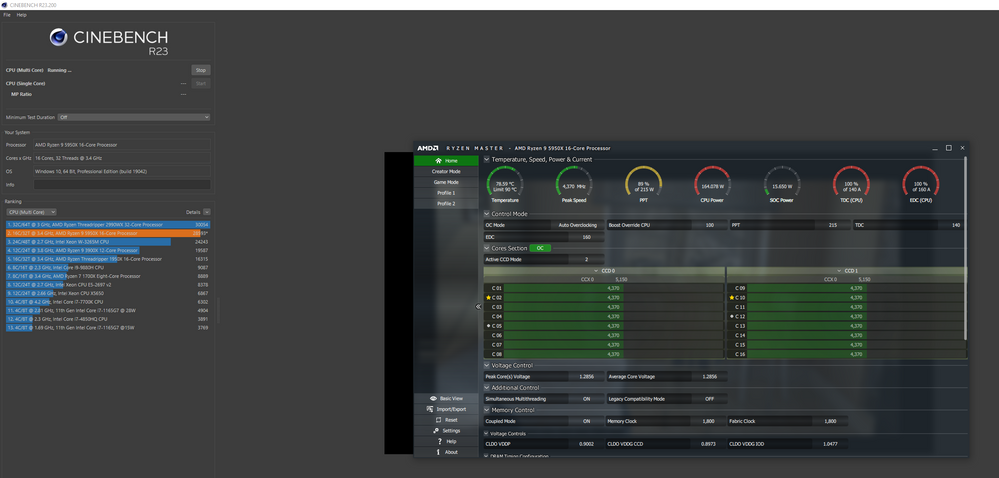
Your CPU is hitting some sort of hard wall in terms of boosting. It looks like it may be temperature related. Your processor is running at lower voltages than mine, but 78C on a multicore load and 75C on single is significantly higher than what I see. Mine is typically in the low 60s on single core and low 70s around multi. Again, it is also strange that single and multicore are so close together. Your CPU is using 151W of power in multi and only a third of that in single, yet the temps are nearly identical? Dissipation is clearly not the issue, as the cooler is dissipating the 151W perfectly fine. Which is why I am curious about the cooler your are currently employing, although I doubt it is the issue here.
Out of curiosity, which Windows power are are you using, and what is your min/max processor percentage in the power states?
- Mark as New
- Bookmark
- Subscribe
- Mute
- Subscribe to RSS Feed
- Permalink
- Report Inappropriate Content
@ajlueke
Please see the above message for cooler info quoted here:
"I've been trying to work out this strange behaviour for months, exact block is the:
"EK-Quantum Velocity D-RGB - AMD Nickel + Acetal"
Full specs and images here:
https://builds.gg/builds/mini-beast-30590"
I also think you may have unfortunately still missed the point I made.
A component in a DC circuit simultaneously pulling 2 different current values is simply not physically possible.
So these numbers don't make sense:
100% of 160A = 160A (EDC)
and
93% if 140A = 130A (TDC)
If the following values were shown it would make sense:
81.3% of 160A = 130A (EDC)
and
93% if 140A = 130A (TDC)
--OR--
100% of 160A = 160A (EDC)
and
123.1% if 140A = 160A (TDC)
The values have to be the same so this alone shows that at the very least the system is reporting incorrect values, so who knows what else is currently wrong with Zen3. What is clear though is that many of us are having problems.
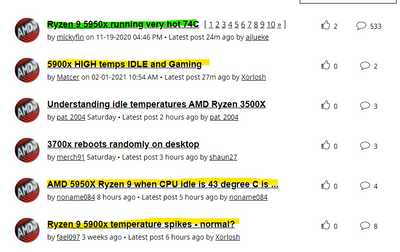
Just look at the processors section of the forums:
This is just on first glance. There are many many more.
Let's face it... it took 5 months for AMD to fix the USB disconnect issue when using PCIe Gen4 and AMD initially didn't admit fault (Only very recently fixed in an AGESA Patch. it took 2-4 months to fully fix the random crashing errors which would cause a system restart (Addressed in AGESA 1.2.0.0).
So far in a very short space of time that is 2 massive patches which fixed essential functionality which initially AMD tried to deny fault, they originally blamed Overclocking for the system crashes and recommended DOWNCLOCKING... which was unacceptable and as soon as media and reviewers learned of this AMD was quick to change their mind and patch this out.
The USB Disconnects have been happening for 5 months at first it was recommended to disable RAM overclock and loosen timings, turn off Gen4 PCIe and also disabling C States. Again this was unacceptable and the same story, as soon as reviewers and media made this widely known only then AMD decided to offer a patch... but for the first 4 months AMD wasn't interested in fixing it.
Funny I can now run my RAM at 3800MHz, FCLK at 1900MHz, with Gen4 PCIe enabled and C-States Enabled and not experience a full system crash or randomly have my mouse or keyboard stop working. Only because people complained.
The performance of this CPU is incredible (Although mine is clearly somehow limited). The experience however has been terrible so far.
I ran a 6700k from launch to Nov 2020 with no issues like this...
- Mark as New
- Bookmark
- Subscribe
- Mute
- Subscribe to RSS Feed
- Permalink
- Report Inappropriate Content
I built at least 38 Zen 3 Systems so far and never encountered those problems - didnt even have the USB Problem that "is so widespread" but ok.
If you really want to solve the problem i would, and i think i said that already, start with the stock values given by AMD and not what ASUS "thinks" its "ok" for EDC / TDC / PPT which should be 142W PPT / 95A TDC (Thermal Design Current) and 140A EDC (Electrical Design Current).
With those values the system should behave normally and deliver baseline scores in typical benchmarks and Temps should be well below 80C (with any decent AIO or Custom Loop)
If that doesnt behave normally i would swap Mobo and/or CPU and try again.
If the baseline is OK you can stark tinkering with the limits...
- Mark as New
- Bookmark
- Subscribe
- Mute
- Subscribe to RSS Feed
- Permalink
- Report Inappropriate Content
Please read my earlier comments in this thread, stock (None PBO w/ AMD defaults) values are shared along with screenshots .
I need to please stress that if you are a "fan" of AMD or not (Attempting to not use the word "fanboy", I just simply purchased the best performing CPU I could as I plan to keep using it for 5+ years) the data shared by me and many others clearly show that there is something wrong. People are quick to question my findings but at the same time quick to ignore the dozens of threads all over the internet all with the same issue.
Please realise that this is no coincidence whether you have experienced these issues or not.
There is no question that something doesn't add up with my numbers
And yes the USB disconnect issue was very widespread, not sure about your use of quotes and dismissal. Just google 'Zen3 USB Disconnects' you will see many threads all over the internet and also see AMD have issued a patch Via AGESA updates.
Patch to fix problem = 100% proof problem existed
- Mark as New
- Bookmark
- Subscribe
- Mute
- Subscribe to RSS Feed
- Permalink
- Report Inappropriate Content
OK - First of all im not a fanboy - i build systems for a living (even Intel Systems what a shocker, i know)
As mentioned already if you have any problem with a system you can only get to the bottom of it with stock settings - everything outside of stock settings is lucky guessing at best.
The few screenshots i saw didnt show Stock settings ergo are invalid - will post a screenshot of baseline stock settings when i get to the shop ...(with temps)
- Mark as New
- Bookmark
- Subscribe
- Mute
- Subscribe to RSS Feed
- Permalink
- Report Inappropriate Content
And at any point did I suggest that you were a fan boy? I was only saying look at my proof from a fresh perspective. I am demonstrating there is something clearly wrong. So is everyone else. Yet people seem quick to judge the individual ability than look at the proof in front of their very eyes. e.g people elsewhere have suggested my cooling is inadequate even after me clearly stating I have a custom loop and linked to my Builds.gg for full parts.
Also try going back a few pages bud. page 49
permalink to exact comment: https://community.amd.com/t5/processors/ryzen-9-5950x-running-very-hot-74c/m-p/462307/highlight/true...
My findings invalid now?
Here as well:
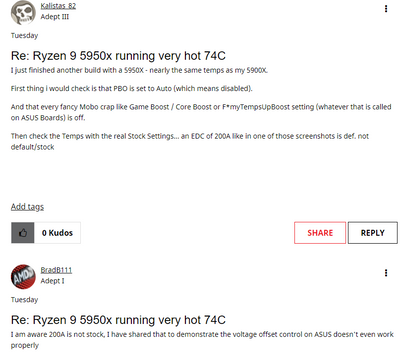
I am well aware that 200A EDC is not stock yet had you have read the previous posts of mine you would understand that's not what I was even concerned with. Yet your first thought seemed to have been assuming that I didn't understand the limits and default behaviours. You would have also seen that I have already shown issues with PBO off too.
your attitude is awful.
- Mark as New
- Bookmark
- Subscribe
- Mute
- Subscribe to RSS Feed
- Permalink
- Report Inappropriate Content
i dont see why my attitude is "aweful" but ok - i just said that im not a Fanboy at all and that finding the source of the problem can only be done via stock settings - outside of those, forget it - and i for one didnt even say your cooling is inadequate - maybe someone else did, i dont care - i only tried to help - but ok...you can also try to keep tinkering with limits here and there and try to get to the problem (which probably by my wild guess is the Mobo) ..
just as reference those following screenshots are done with stock limits and -30 on the Curve Optimizer (no PBO since that WILL f* with your temps) with a normal NZXT X73 with **bleep**ty stock fans - Nr 1 is Idle Nr 2 all Core Load with CB - add another 3C for a 30min run when the coolant reaches its peek temp at around 33C @ max Pump speed of 2800rpm; 5950X have roughly the same Temp as a 5900X (at least the 11 i built have) - if that baseline is the same with your Chip - the CPU is fine and its the f* up limits ASUS is useing on their Mobos atm.
PS: Games / Windows Defender Scans / CHROME (esp. Chrome!) will cause higher Temp Spikes for a short time (and thats normal)
Im even on Bios A8 (X570 Unifiy) - AGESA 1.2.0.0 (without the "USB fix" since i never encountered that problem and im using 3 PCIE Gen4 NvME drives)...
Take from it what you will.
- Mark as New
- Bookmark
- Subscribe
- Mute
- Subscribe to RSS Feed
- Permalink
- Report Inappropriate Content
I didn't mention it was yourself who made a commend about the cooling being inadequate either. I am only saying that people are quick to make assumptions only knowing half the story and not looking at all of the information.
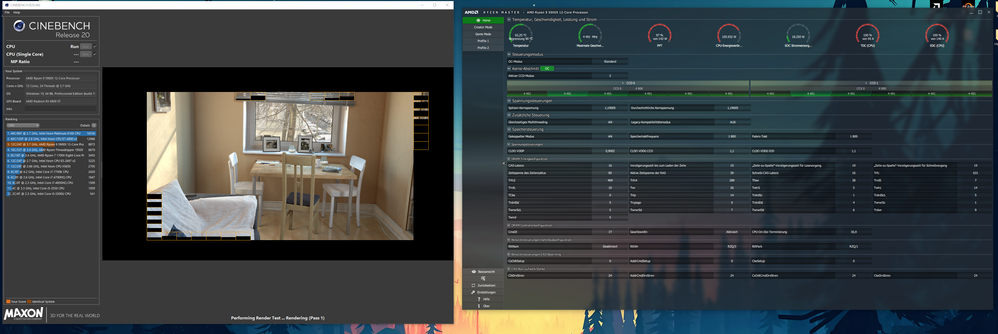
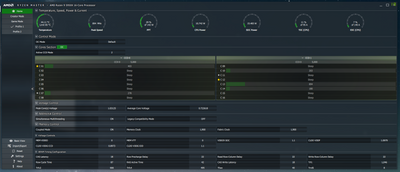
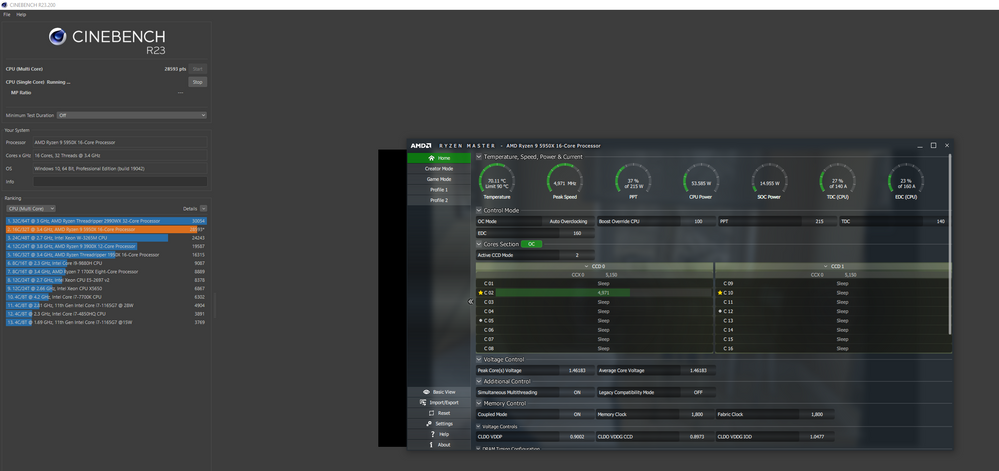
Ok so here are my stock results with a -25 on curve optimizer, latest non beta BIOS for crosshair VIII Impact I did have USB issues and also run 2x NVME m.2 Gen4 Drives in Raid 0:
all core:
single core:
Think we can both agree.... these clocks are terrible and for some reason my single core temps are higher than all core.
And I hope we can both agree, there is clearly something wrong.
EDIT: forgot to add idle:
- Mark as New
- Bookmark
- Subscribe
- Mute
- Subscribe to RSS Feed
- Permalink
- Report Inappropriate Content
we can agree that the clocks are terrible - it seems the CPU doesnt get enough power - CPU Power should be at ~105W with an all core load and not ~96W (which isnt a high diviation but still) - single core will be higher in temps and thats normal (more voltage higher clock) - if you have the chance i would test the cpu with another Mobo (preferable not Asus)
- Mark as New
- Bookmark
- Subscribe
- Mute
- Subscribe to RSS Feed
- Permalink
- Report Inappropriate Content
I have been keeping my eyes open for another mobo, all friends that have a compatible mobo all have ASUS. I also did originally feel this was a mis management in how ASUS boards controlled the power to these chips.
Another fun fact, if you look at other threads of other people with the same issue. Most likely an ASUS board.
Also if I seem to give the CPU more power (using PBO with minor increased limits over stock) it just sits at around 80c in tests and gaming... I can't get a good result either way.
- Mark as New
- Bookmark
- Subscribe
- Mute
- Subscribe to RSS Feed
- Permalink
- Report Inappropriate Content
"single core will be higher in temps and thats normal (more voltage higher clock)"
That is most decidedly not normal. And in fact, even with PBO enabled on my ASUS Crosshair VII X470 I see around 61C at 1.47V and 70C at 1.3V for multi core. Using all the cores generates far more heat than a single core ever could, which is reported by the total CPU power in the case.
What it is telling us, is that when @BradB111 system has a workload that is localized to CCD0, the CPU package heats up far more than when it is split between two, even though the total power to be dissipated is higher. Than implies that either, the heat is having a hard time escaping the cores on CCD0 to the IHS (bad solder) or, the coverage of the cold plate on this cooler over that chiplet isn't great.
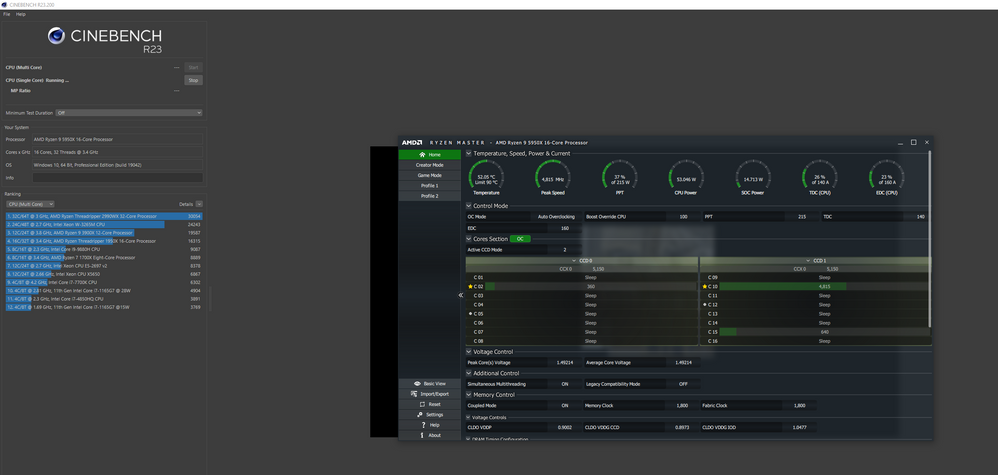
As a (fun?) experiment, run Cinebench single with your PBO settings as normal. Note the heat levels. Now, install process lasso, and use that to limit Cinebench to the best core on CCD1 by setting processor affinity for that application. Run the test again. The best core on CCD1 won't be able to hit the same clocks as CCD0 but with the same voltage and amperage, the heat generated should be similar. If that runs cooler, there is a problem with dissipation from CCD0. If that is also high, then the motherboard is almost certainly doing something wonky when single threaded loads are applied.
- Mark as New
- Bookmark
- Subscribe
- Mute
- Subscribe to RSS Feed
- Permalink
- Report Inappropriate Content
that is decidedly normal unless all the builds i made so far are "defective".... single core will or let me rephrase that "can" cause temp spikes higher than an all core load esp. stuff like Chrome / Windows Defender Scans etc.
I even did tests all the cores now - every Core (for my Chip hits at least 4950Mhz... the 2 best Cores each reach around 5050 - that is without PBO just Curve Optimizer with -30) - without CO i get 4950 on the best cores and around 4850 for the others - Single Core run for each Core once - Silicon Lottery at its best...
- Mark as New
- Bookmark
- Subscribe
- Mute
- Subscribe to RSS Feed
- Permalink
- Report Inappropriate Content
I understand your point, but you are misconstruing the two fields as a real time measurement of VRM amperage which is not the case.
If a processors is running at a consistent sustained load, the processor should be running at TDC amperage. Yet the EDC will not read 0% just because the sustained amperage is not in use. Also, the EDC will not read 87.5%, if 140A are being applied through TDC and EDC is 160A. That is because an 87.5% in EDC would imply that the system is using 140A when in the boost vs sustain state, which is not the case.
Similarly, If and EDC boost is occurring at 160A, the TDC does not read 114%, because that would imply that a sustained load of 160A is being applied which is also not the case. Instead, what is reported is the proportion of each amperage that is used, when the processor is in boost/sustained state.
So to be clear, TDC is the max sustained amperage, and during a workload Ryzen master will report what percentage of amperage is being used when the VRMs are in the sustained state. EDC then reports what amperage is being used in the boost state.
Now as to how often the VRMs are in either state we don't know, and Ryzen master certainly doesn't tell us. These values have been reported this way in every instance of Ryzen dating back to Zen+ at least.
So to go back to your example
"100% of 160A = 160A (EDC)
and
123.1% if 140A = 160A (TDC)"
That perhaps makes sense, but it is wholly inaccurate. 123% on TDC implies that 160A is being supplied during a sustained load, which is it isn't, it is being supplied as a transient boost amperage, which is filed under EDC.
But, back to the task at hand.
The EK-Quantum Velocity D you employ does have a Ryzen specific version that appears to have improved to liquid flow over the chiplets. I can't seem to find any reviews on one vs the other, but perhaps that is the reason for the sub optimal temps you are seeing? It seems unlikely that it would really make that big of a difference, but it is something to consider.
I also have a 5950X and RTX 3090 and am seeing far better temps. However, my RTX 3090 is not currently tied into my loop as EK only recently shipped the block for the RTX 3090 FE. I'll get my GPU block on Tuesday, and once it is in the loop it is entirely possible my results will now mirror yours. More to come on that I guess.
Another thing I noticed is the 3800 MHz RAM and 1900 IF. Does it affect temps at all to run the controller at 3600 MHz 1800 IF? That is what I am using, and I noticed another user with high temps had the high RAM speed as well.
I would also try to set the power plan to Windows Balanced (Latest chipset driver) and see what that does.
I do think you have some valid points about ASUS, at least as far as the Impact is concerned. Setting EDC below TDC is beyond strange, and there is no telling what other things may be mixed up in the UEFI as you stated.
- Mark as New
- Bookmark
- Subscribe
- Mute
- Subscribe to RSS Feed
- Permalink
- Report Inappropriate Content
"misconstruing the two fields as a real time measurement of VRM amperage"
I was under the impression the gauges gave a real time measurement yes. I thought this would be intended but so many things seem backwards so doesn't surprise me. So the reason it results in 2 different values is due to switching?
In which case would my values (Low clocks, high temps) potentially be a result of the VRM PWM switching frequency? Got any guidance on this?
"100% of 160A = 160A (EDC)
and
123.1% if 140A = 160A (TDC)"
I used this example although yes it would not be accurate at all (and impossible due to limits) it would at least make sense assuming the EDC and TDC gauges are displaying real time values but you say this isn't the case unless I misunderstood?
"The EK-Quantum Velocity D you employ does have a Ryzen specific version"
This is true, to an extent. and agree it would barely make a difference, at least not the 20c difference between my experience and the numbers in all the reviews. Upon on checking the product page on EK it seems to be the one I require anyway.
I suppose AM4 would by default mean 'ryzen' also.
"I also have a 5950X and RTX 3090 and am seeing far better temps. However, my RTX 3090 is not currently tied into my loop as EK only recently shipped the block for the RTX 3090 FE. I'll get my GPU block on Tuesday, and once it is in the loop it is entirely possible my results will now mirror yours. More to come on that I guess."
I'll look forward to this. These parts are rare enough as it is, trying to find someone with these parts + both in the same custom loop willing to look at temps is even more rare so the any info you would be able to share I think would be valuable.
"Another thing I noticed is the 3800 MHz RAM and 1900 IF. Does it affect temps at all to run the controller at 3600 MHz 1800 IF? That is what I am using, and I noticed another user with high temps had the high RAM speed as well."
I have unfortunately already ruled this out by running at 3600MHz / 1800MHz FCLK and also 2133 MHz / Auto FCLK. I did think of this a few months ago possibly adding extra load therefor heat but it seems to make no difference. Thank you anyway though. I'd happily run at 3600MHz if this was the case haha.
"I would also try to set the power plan to Windows Balanced (Latest chipset driver) and see what that does."
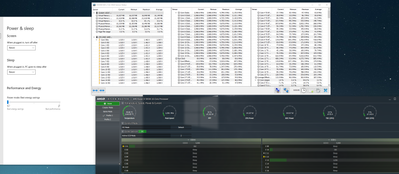
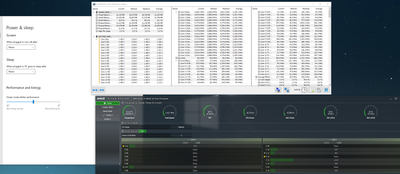
This is the plan I am currently running (Balanced power plan) only seems to make a degree or 2 difference. However this new setting in a recent windows build does decrease idle temps while not effecting peak performance:
Strangely this setting is also not even tied to the power plan so I don't actually know exactly what this changes as everything in the advanced settings window remains unchanged.
This is how my CPU sits at both settings:
"What it is telling us, is that when @BradB111 system has a workload that is localized to CCD0, the CPU package heats up far more than when it is split between two, even though the total power to be dissipated is higher. Than implies that either, the heat is having a hard time escaping the cores on CCD0 to the IHS (bad solder) or, the coverage of the cold plate on this cooler over that chiplet isn't great. If that is also high, then the motherboard is almost certainly doing something wonky when single threaded loads are applied. "
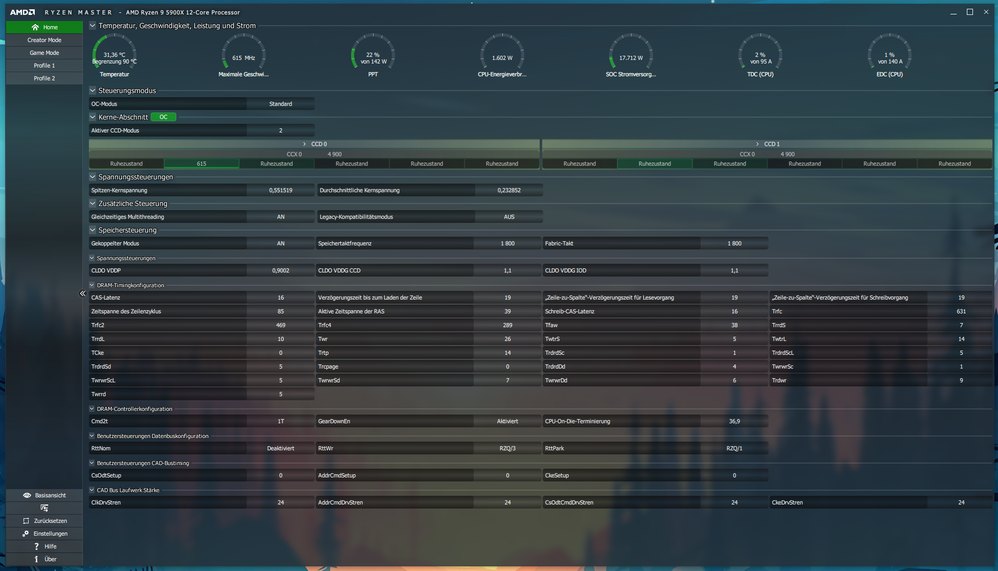
There is something going on for sure. let me find the offset voltage issue I noticed months ago I also included a screenshot a few days back. As I do think it is relevant to what you are saying here:
Each CCD is acting completely differently just with a negative 0.1v offset (Across the whole CPU). Seems very strange to me. If somebody could confirm that a -0.1v offset causes both of their CCDs to behave like this (differently to each other) or you see the same behaviours across both CCDs, that may also be helpful.
"As a (fun?) experiment, run Cinebench single with your PBO settings as normal. Note the heat levels. Now, install process lasso, and use that to limit Cinebench to the best core on CCD1 by setting processor affinity for that application. Run the test again. The best core on CCD1 won't be able to hit the same clocks as CCD0 but with the same voltage and amperage, the heat generated should be similar. If that runs cooler, there is a problem with dissipation from CCD0. "
Sure, why not. For this I have changed my curve optimiser setting to -12 across all cores just so it's a fair test:
CCD0:
CCD1:
hmmm.... You may be on to something there although windows / background processes I would assume are also favouring CCD0 also? Can you also test this if it's not too much trouble?
"Silicon Lottery at its best..."
Silicon lottery is one thing, not being able to get rated speeds unless I stop all possible processes, run fans at 100% and have all case panels off with my room window open with it being 3c outside and also limiting my GPU in the loop to minimum possible power limit for least effect on the loop. to only just get 4905MHz for a split second is another thing.
- Mark as New
- Bookmark
- Subscribe
- Mute
- Subscribe to RSS Feed
- Permalink
- Report Inappropriate Content
my "Silicon lottery" was related to the "fun" experiment and the best Cores of CCD0/1not hitting the same frequency - which they do in my case.
I think its established that something is wrong with your system - and i would still point to the mobo as the culprit - but only you can test that anyway
- Mark as New
- Bookmark
- Subscribe
- Mute
- Subscribe to RSS Feed
- Permalink
- Report Inappropriate Content
"i would still point to the mobo as the culprit - but only you can test that anyway"
I think that @BradB111 most recent data indicates that the motherboard is likely not the culprit. When the load is shifted to CCD1, the motherboard is actually doing everything identically. The CCD1 core is actually not that much worse than the CCD0 as you had indicated. The frequency is within 100 MHz, and the voltage and amperage are only slightly higher. So yes, it is less efficient, but not substantially.
But what is substantial is the temp difference. A 10C delta just by moving to a different CCD is considerable. And I really doubt the block is responsible for that.
- Mark as New
- Bookmark
- Subscribe
- Mute
- Subscribe to RSS Feed
- Permalink
- Report Inappropriate Content
Although likely true (Although I really hope not) it doesn't necessarily explain the strange behaviour when I use a voltage offset. and I do think the added temps could quite possibly be due to win background processes sitting on other cores on CCD0. Awaiting your results (I ran mine with all my usual programs open, Discord, Whatsapp desktop, steam, etc....)
May retest with minimal possible programs running.
- Mark as New
- Bookmark
- Subscribe
- Mute
- Subscribe to RSS Feed
- Permalink
- Report Inappropriate Content
Wow. The CPU power when the load is shifted to CCD1 is actually higher than CCD0, yet it is almost 10C cooler. I will do the experiment on my system as well to compare. But it is looking like there is actually a physical problem between CCD0 and the IHS. Cold plate designs and the liquid flow can make a difference, but the delta you are seeing seems far to big.
Also, your radiator setup 2X360PE is within 15% of the dissipation I have 280 and 420CE, so that can be ruled out as well.
- Mark as New
- Bookmark
- Subscribe
- Mute
- Subscribe to RSS Feed
- Permalink
- Report Inappropriate Content
I would like to clarify that both average around 63W total power but fluctuate slightly, I think I may have been able to quite easily make CCD0 look like it's taking more power if I timed the screenshots right. But yeah, its not looking good, I just hope its a case of background processes elevating CCD0 temps
- Mark as New
- Bookmark
- Subscribe
- Mute
- Subscribe to RSS Feed
- Permalink
- Report Inappropriate Content
"I just hope its a case of background processes elevating CCD0 temps"
Hmmm, that is possible, but should also be fairly easy to test. Under process lasso, you could limit all applications on your PC to the CCD1 cores. Then assign Cinebench only to your best core on CCD0 and run the single threaded test. Any improvement there?
- Mark as New
- Bookmark
- Subscribe
- Mute
- Subscribe to RSS Feed
- Permalink
- Report Inappropriate Content
Hmm... every process on CCD1 but Cinebench on CCD0 has the same results...
Due to the strange behaviour of the voltage offset it may still be how the mobo addresses each CCD perhaps?
- Mark as New
- Bookmark
- Subscribe
- Mute
- Subscribe to RSS Feed
- Permalink
- Report Inappropriate Content
Well, good news and bad news. I ran the test on my PC, and I actually see the same thing you saw, which is not what I was expecting. Running a load on CCD1 had lower temps by about 10C vs the same load on CCD0. However, my absolute temps are about 15C lower than what you are seeing. Good news, the CPU behavior actually appears normal. Bad news is we are right back to the original issue.
- Mark as New
- Bookmark
- Subscribe
- Mute
- Subscribe to RSS Feed
- Permalink
- Report Inappropriate Content
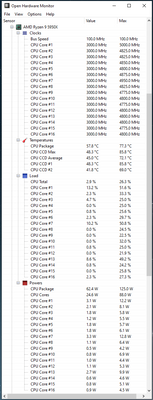
It will be interesting to see your temp vs frequencies by letting Open Hardware Monitor run for a couple of hours when using your computer.
That way we can see better if your temp are lower with same frequencies or not. I also notice an average difference of 15°C between CCD1 and CCD2, but stock, the frequencies are higher on CCD1 as you can see in attached capture.
- Mark as New
- Bookmark
- Subscribe
- Mute
- Subscribe to RSS Feed
- Permalink
- Report Inappropriate Content
BTW, forgot to mention that, so far, no more crash since setting my PSU to 'typical' power instead of AUTO.
And also, that I noticed my average temp went down by a couple of degrees since applying last Asus Bios 3501.
Might be to early to be sure that the crash issue is solved but that is definitely more stable...
- Mark as New
- Bookmark
- Subscribe
- Mute
- Subscribe to RSS Feed
- Permalink
- Report Inappropriate Content
I think as far as @BradB111's issue was concerned, I was hoping that we had narrowed it down to the CPU. But, as you say, it appears to be typical behavior for CCD0 to run 10C hotter than CCD1 with the same amperage/voltage applied. However, @BradB111 is still running about 15C hotter than I am on his Ryzen 9 5950X. We have similar EK cooling setups. One caveat there is that my RTX 3090 is not currently in the loop. So I will look at temps again once it is.
We seem to have identical Windows and PBO settings at this point. The only other differences are he is using an ASUS X570 Impact motherboard, and I am on an ASUS X470 Crosshair VII. There was some weirdness with the Impact motherboard, in that @BradB111 noticed the CCDs behaved different when he had a voltage offset in place. And also ASUS programmed bizarre motherboard PPT/TDC/EDC limits for the Impact, where EDC was actually lower than TDC.
There is a thread with an almost identical setup.
https://www.reddit.com/r/Amd/comments/kwq9sj/5950x_crosshair_viii_impact_ballistix_32gb/
From what I can tell, the only major difference is the CPU block and the RAM used.
- Mark as New
- Bookmark
- Subscribe
- Mute
- Subscribe to RSS Feed
- Permalink
- Report Inappropriate Content
- Mark as New
- Bookmark
- Subscribe
- Mute
- Subscribe to RSS Feed
- Permalink
- Report Inappropriate Content
Okay. RTX 3090 FE has been added in to the loop. All temps are about 10C higher.
So I am now running about 70C in single core and 78C in Multi. Clock speeds have dropped a bit as well. So while they aren't quite as high as yours, we are probably within margin of error now. That RTX 3090 really adds some heat.
- Mark as New
- Bookmark
- Subscribe
- Mute
- Subscribe to RSS Feed
- Permalink
- Report Inappropriate Content
Thank you for sharing this... If only my numbers were as good as yours.
Do your temps also go through the roof while gaming?
- Mark as New
- Bookmark
- Subscribe
- Mute
- Subscribe to RSS Feed
- Permalink
- Report Inappropriate Content
I'll try out a few different titles and see what happens. It is a little perplexing that my temps are higher even when I immediately run Cinebench. The GPU isn't really doing much, so I'm not sure where the extra 10C is coming from.
- Mark as New
- Bookmark
- Subscribe
- Mute
- Subscribe to RSS Feed
- Permalink
- Report Inappropriate Content
Probably GPU via PCIe slot and also motherboard components as VRM.
- Mark as New
- Bookmark
- Subscribe
- Mute
- Subscribe to RSS Feed
- Permalink
- Report Inappropriate Content
If this was the case the additional temps would be present when the card is air cooled also.
- Mark as New
- Bookmark
- Subscribe
- Mute
- Subscribe to RSS Feed
- Permalink
- Report Inappropriate Content
Indeed. The only thing that has changed is the GPU was added into the loop. @BradB111 how is your cooling loop configured, as in, what is the loop order?
- Mark as New
- Bookmark
- Subscribe
- Mute
- Subscribe to RSS Feed
- Permalink
- Report Inappropriate Content
As I'm sure you know loop order doesn't really matter especially when the fluid reaches equilibrium temp.
But:
Pump/Res combo > top 360 rad > GPU > CPU > bottom 360 rad > Pump/Res combo > .....
- Mark as New
- Bookmark
- Subscribe
- Mute
- Subscribe to RSS Feed
- Permalink
- Report Inappropriate Content
Right. I don't exactly know what is going on here.
My setup uses a manifold with quick disconnect fittings. That way I can plug/unplug a CPU or GPU without draining the loop. It is parallel flow however, so by connecting the GPU the CPU block is getting less flow than it was without. I wouldn't think that would matter, since D5 pumps cycle liquid so rapidly.
Now I am wondering, if I moved the loop to serial, would my original performance be restored? Are the CPU blocks extremely sensitive to flow rate and restriction? Your loop is in serial however, and your seeing even higher temps, so I'm not sure the test is worthwhile.
- Mark as New
- Bookmark
- Subscribe
- Mute
- Subscribe to RSS Feed
- Permalink
- Report Inappropriate Content
Flow rate is negligible. In systems I have built, 100% pump speed Vs inaudible speeds showed no difference. (Both D5 and DDC). Including this one.
At the moment I'm running at 27% where it's almost inaudible. If I put it to 100% the only thing that changes is the level of noise.
Maybe test this yourself by testing lower and higher pump speeds on your PC? I believe the only change is the quicker the pump the slower the time to reach equilibrium. But temperatures should remain pretty much the same.
In your system after the coolant has been through both the GPU and CPU blocks does it return to the same Res? If so this could still be a point where temperatures are effecting your CPU.
I'm relatively sure that my issue is somewhat related to my GPU being in the loop which is why I understand why during gaming it will get quite high but with my GPU limited to lowest possible power limit and underclocked my CPU performance is still sub par when running CPU only bench like cinebench so something strange going on for sure.
- Mark as New
- Bookmark
- Subscribe
- Mute
- Subscribe to RSS Feed
- Permalink
- Report Inappropriate Content
yeah I'm seeing 89C when gaming on COD, and idle temps as low as 37C running on Z73. Nothing overclocked, just running XMP haven't noticed 90C, but it's still cold. I'm guessing in the summer time when ambient temps really heat up, it'll be well into the 90's.
- Mark as New
- Bookmark
- Subscribe
- Mute
- Subscribe to RSS Feed
- Permalink
- Report Inappropriate Content
My system, the reservoir/pump combo feeds the manifold, and the flow splits to both the CPU/GPU from the manifold. Then the flow returns from both CPU and GPU to the opposite chamber on the manifold and exits to the radiators before returning to the pump/reservoir. I have tested flow rate in the past, and similar to your description I have noticed maybe a 1-2C difference at the most.
While it isn't unexpected for the temps to go up with the RTX 3090 in the loop, as it kicks out a lot of heat. It is strange as you say that I see nearly a 10C shift upward even in testing where the GPU isn't doing much. So the options are, either the GPU addition is shunting off so much flow that my CPU temps are affected, or the GPU adds a significant amount of heat to the system even when idle.
- Mark as New
- Bookmark
- Subscribe
- Mute
- Subscribe to RSS Feed
- Permalink
- Report Inappropriate Content
@ajlueke
Of course the 3090 does produce much of heat. And if you don't have a full tower chassis, it's even worst. So one good solution is if you have an AIO or a custom loop liquid cooling that it doesn't provide extra warm air that it's combined with the 3090's and make things worst in terms of temperatures.
Even in my system that I am using an AIO and the MSI Suprim X RTX 3090, in the stock BIOS settings I can easily reach 90c with full stress. That's why I have made a specific settings that makes the CPU in full stress to reach about 80c. But the reason I chose a mid tower was because I didn't want a big case for my room environment at the moment and for aesthetics reasons too.
- Mark as New
- Bookmark
- Subscribe
- Mute
- Subscribe to RSS Feed
- Permalink
- Report Inappropriate Content
In this case the results are surprising because the temps on the 5950X went up 10C just by adding the GPU into the loop. Even when the RTX 3090 FE is idle and drawing only >20W according to GPUz, I still see are large increase in temps.
That tells me that the restriction on the CPU portion of my loop is sufficiently high that I am diverting most of my flow to the GPU and affecting CPU temps. I am going to try setting up the loop in serial and see if my original results are restored.
- Mark as New
- Bookmark
- Subscribe
- Mute
- Subscribe to RSS Feed
- Permalink
- Report Inappropriate Content
Honestly mate flow rate is not your issue.
I doubt you will notice any benefit from changing it all round.
