Get Started with Omnitrace — A comprehensive performance profiling, tracing, and analysis tool
- Subscribe to RSS Feed
- Bookmark
- Subscribe
- Printer Friendly Page
- Report Inappropriate Content
Profiling presents application developers with a catch-22. We need to understand how our code performs on any given hardware in an iterative fashion to reduce bottlenecks and get the most out of the programming environment. At the same time, developers don’t want to spend a significant amount of time devoted to profiling because they would prefer to maximize their time on our systems running critical applications and developing new capabilities in their applications. No wonder application developers are always looking for better and more efficient solutions for visualizing their code running on their AMD EPYC CPUs and AMD Instinct GPU accelerators.
If you were tasked with improving the performance of the application you are currently working on, what tool would you choose?
With that in mind, we are excited to introduce, a hybrid CPU/GPU profiling and tracing tool developed by AMD Research to support the needs of our ML, AI and HPC application developers. Omnitrace is a new, comprehensive tool that combines the capabilities of familiar CPU and GPU profilers and a wealth of new features to provide a streamlined, rich visualization of application environments. [Curious already? Here’s our GitHub repository to download along with extensive documentation and some online tutorials to get you started.]

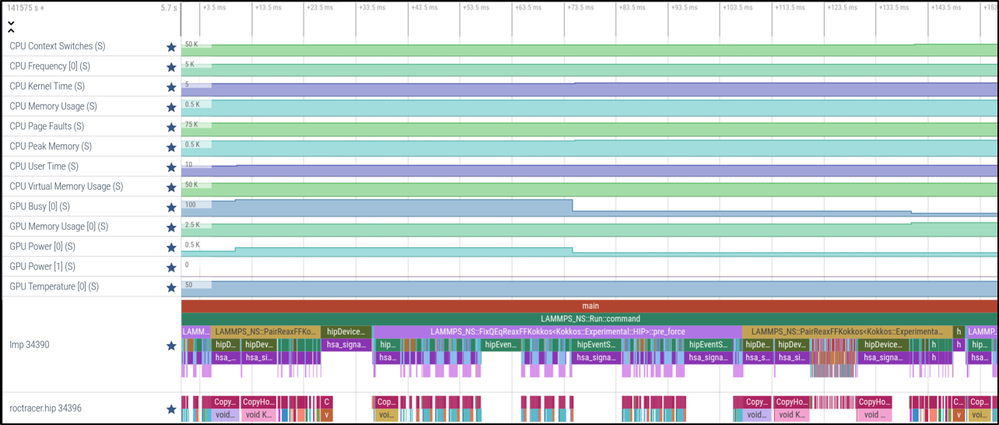
Figure 1. Omnitrace can provide CPU and GPU power/frequency/temperature information in a single trace of a single-GPU LAMMPS run. Here we see the GPU Utilization (GPU Busy) and GPU Power draw, drop during the middle of a long synchronization event waiting on MPI communications. LAMMPS is a molecular dynamics application developed primarily at Sandia National Laboratories.
We think Omnitrace will be a game-changer. Until now, uProf told you what is happening on your CPU, rocProf about your GPU, and 3rd party tools (such as HPCToolkit or TAU) delivered additional valuable information, but all those pieces have been discrete. Application developers have had to find their own clever ways of bringing everything together. That’s a problem because the most valuable insights often lie at the intersection of multiple tools. “Omnitrace strives to address this problem by supporting multiple modes of code instrumentation, call stack sampling, and system management interface (SMI) data collection,” explains Jonathan Madsen, lead developer of Omnitrace, Senior Member of the Technical Staff, AMD Research. Omnitrace will let you do deep dives into your CPU work, tunneling down the call stack of functions to see how time is spent, which is critical for diagnosing runtime issues, kernel scheduling, and other challenges. Omnitrace is a fully functional CPU profiler, so you’ll be able to understand what’s going on with your application and the handoff from CPU to GPU. Ultimately, for all use cases, Omnitrace provides a way to get the critical performance information you need while requiring much lower developer overhead than previous tools.”
Omnitrace for AI/ML workloads
Omnitrace fully supports Python, very handy for those in the AI/ML community. While PyTorch and TensorFlow provide high-level profiling, Omnitrace goes further by helping you diagnose performance. Omnitrace can do binary rewrite of compiled Python modules and give you a view of everything happening at the Python level, as well as on the GPU and the C / C++ code underneath the Python layer.
In fact, Omnitrace supports three types of binary manipulation. A developer can launch a binary executable and Omnitrace will modify the binary and insert timing measurements around specific function calls. Alternatively, a developer can achieve the same result by attaching to a running process or by reading in a binary and selecting the functions to instrument. Omnitrace will then generate a new binary to run.
Omnitrace for HPC workloads
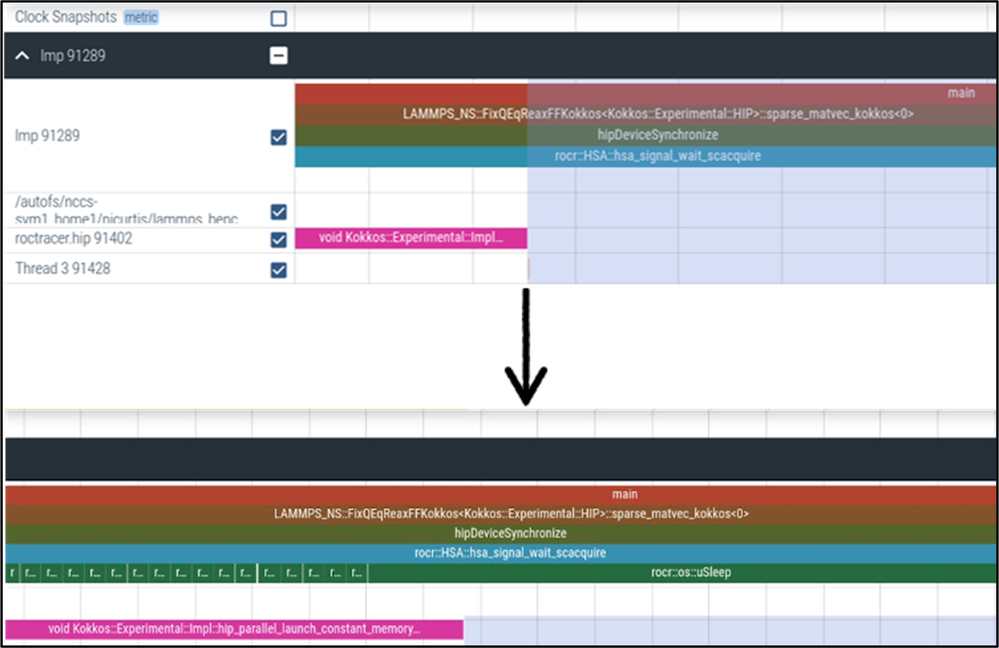
We built Omnitrace to scale up to large-scale HPC applications with numerous processes running. Recently, Omnitrace was used by AMD application experts in the Frontier Center of Excellence in order to diagnose a software performance problem at scale. As the problem only occurred consistently when running on thousands of GPUs, it was critical to keep the size of the collected traces to a minimum to be able to efficiently post-process and analyze them. “The flexible binary-rewrite capabilities in Omnitrace were invaluable to this debug, as this enabled AMD to instrument only the specific runtime functions of interest, and selectively work our way down the software stack until we were able to isolate the issue," says Nick Curtis, AMD Performance Tools Lead, Frontier Center of Excellence.

Figure 2. Using Omnitrace on Frontier to progressively instrument lower-level parts of the ROCm software stack to diagnose scaling issues.
“Our customers’ business case for GPU acceleration is entirely about application software performance, and a highly capable profiler is the primary window into examining where a software system needs attention and why. I’m looking forward to how our newly released Omnitrace tool will accelerate application development for both our high-end customers and our internal development teams,” says Jeff Kuehn, Sr. Director Software Solutions Group from the Data Center GPU Business Unit.
So what can Omnitrace do for you today?
In creating Omnitrace, AMD Research listened to extensive feedback and requests from our developer community. We aim to bring as much formerly disparate information into a single timeline view so you can more effectively triage performance issues and get the most from your environment. Omnitrace functionality includes:
- Runtime instrumentation and binary instrumentation of CPU code (HIP/HSA/Pthreads) for timeline visualization
- GPU kernel timeline visualization
- CPU-side PC sampling (on-process and per thread)
- SMI (for power/frequencies, etc.) on CPU and GPU
- Hardware counters for the CPU and GPU
- Output to:
- Perfetto [timeline]
- JSON [per-call-stack stats]
- Plain-text [per-call-stack stats]
- Hooks for Third-party libraries (Kokkos, OMPT, Python, Caliper, etc.)
- Communication libraries (MPI, RCCL)
- Critical traces per thread
With fine-grained control over what information you want to map to your timeline, Omnitrace lets you find the optimal balance between overhead and information.
Get started with Omnitrace today
Omnitrace is still in active development, but we’re eager to see you put this powerful, comprehensive profiling tool through its paces now. We’re already noticing a lot of downloads and increasing forks on our Omnitrace GitHub repository. As with everything we do here at AMD, Omnitrace is open source and community driven. We are building Omnitrace for you and iterating quickly, so we want to hear from you with your feedback and feature requests. “The Omnitrace tool is currently independent of the ROCm software stack, so we can maintain a fast cadence in fixing issues and new feature requests,” says Ronnie Chatterjee, Software Product Manager – GPU Compute (ROCm), Data Center GPU Business Unit. Make your voices heard through GitHub discussions, pull requests and issues.
Installation is easy and again; we’ve created a series of online tutorials (more to follow) to help you get started. Consider this your official invitation to join AMD in creating the ultimate profiling tool for your application development.
AMD Contributors to this Omnitrace blog include Jonathan Madsen, Lead Developer, Omnitrace | AMD Research, Nick Curtis, AMD Performance Tools Lead | Frontier Center of Excellence, and Ronnie Chatterjee, SW Product Manager - GPU Compute | Data Center GPU BU
More Information
ROCm webpage: AMD ROCm™ Open Software Platform | AMD
ROCm Information Portal: AMD Documentation - Portal
AMD Instinct Accelerators: AMD Instinct™ Accelerators | AMD
AMD Infinity Hub: AMD Infinity Hub | AMD
