- AMD Community
- Communities
- Server Processors
- Server Processors
- Re: AMD uProf for golang on Windows10
Server Processors
- Subscribe to RSS Feed
- Mark Topic as New
- Mark Topic as Read
- Float this Topic for Current User
- Bookmark
- Subscribe
- Mute
- Printer Friendly Page
- Mark as New
- Bookmark
- Subscribe
- Mute
- Subscribe to RSS Feed
- Permalink
- Report Inappropriate Content
AMD uProf for golang on Windows10
I want to reopen this issue (now in a right subforum). I still have a problem with profiling golang application on windows 10 with manually generated .pdb files. Below steps worked for a few profile sessions and i dont know why (seems like something specific mustve happen), because after app rebuild (and .pdb regenerate) that never worked again:
I got it working. Firstly i built application with exported, uncompressed dwarf symbols:

go build -gcflags="all=-N -l -E" -ldflags="-compressdwarf=false" -o main.exe

Next step was to convert dwarf symbol to .pdb with cv2pdb tool as it was quite important that i run profiler on Windows.

It wasnt working even despite i specified folder where profiler should search for that .pdb file (the Add Symbol File Location(s) field). I copied .pdb file manually to the folder under Symbols Download Path field at it magically started to work.
CheatEngine didnt had problem to resolve debug symbols generated that way, so i think this problem may be specific to AMDuProf. Additionaly this: https://community.amd.com/t5/server-gurus-discussions/amd-uprof-does-not-see-my-pdb-file/m-p/42820 topic seems very related to mine. What else can you suggest to me to try?
- Mark as New
- Bookmark
- Subscribe
- Mute
- Subscribe to RSS Feed
- Permalink
- Report Inappropriate Content
Hi @patrulek
AMD uProf support for PDB file (generated using cv2pdb tool) is not yet added. We will plan to add this support in the future release.
- Mark as New
- Bookmark
- Subscribe
- Mute
- Subscribe to RSS Feed
- Permalink
- Report Inappropriate Content
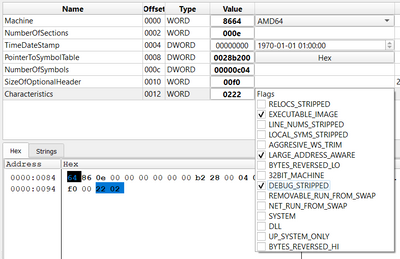
I dug into this topic one more time with newest Golang compiler and newest AMDuProf. New release still doesn't work with .pdb's generated by `cv2pdb` on Golang application by default, but i probably found a correct workaround this time. Go application is built with `DEBUG_STRIPPED` flag. When i remove this flag manually, AMDuProf is showing valid symbols. Unfortunately i didnt found out why this flag is set and how to prevent it to be set during build, but its out of scope of this thread.
- Mark as New
- Bookmark
- Subscribe
- Mute
- Subscribe to RSS Feed
- Permalink
- Report Inappropriate Content
Hi @patrulek ,
Thank you for sharing the details here. We are yet to add golang support. We will consider this information when we add the support.
