- Mark as New
- Bookmark
- Subscribe
- Mute
- Subscribe to RSS Feed
- Permalink
- Report Inappropriate Content
AMD uProf for golang on Windows10
Hi, i want to profile golang application on Windows 10 with amd uprof, but have hard time to make it work. Is it even possible? I saw in the guide that golang isnt supported language for this profiler, but shouldnt it be enough to have generated debug symbols? Golang generate `DWARF` symbols by default and i tried also cv2pdb tool to convert it to .pdb file, but none of these solutions worked.
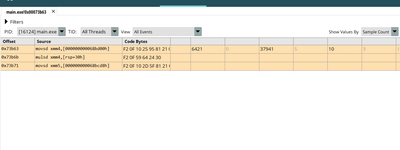
By "it doesnt work" i mean that the profiler cant resolve addresses to function names and doesnt show source files, just short disassembly snippets.
It looks like this, while i would expect to see function name under offset address together with source code for this piece of code:

Solved! Go to Solution.
- Mark as New
- Bookmark
- Subscribe
- Mute
- Subscribe to RSS Feed
- Permalink
- Report Inappropriate Content
Ok, thanks for redirecting. I already found out solution for that anyway. For future generations it can be found here: https://stackoverflow.com/a/72586562/5445004
- Mark as New
- Bookmark
- Subscribe
- Mute
- Subscribe to RSS Feed
- Permalink
- Report Inappropriate Content
This question is best posted at AMD Forum Server GURU that deals with everything to do with uPROF: https://community.amd.com/t5/server-gurus/ct-p/amd-server-gurus
- Mark as New
- Bookmark
- Subscribe
- Mute
- Subscribe to RSS Feed
- Permalink
- Report Inappropriate Content
Ok, thanks for redirecting. I already found out solution for that anyway. For future generations it can be found here: https://stackoverflow.com/a/72586562/5445004