- AMD Community
- Communities
- Developers
- Server Processors
- Re: Amd uProf 3900X
Server Processors
- Subscribe to RSS Feed
- Mark Topic as New
- Mark Topic as Read
- Float this Topic for Current User
- Bookmark
- Subscribe
- Mute
- Printer Friendly Page
- Mark as New
- Bookmark
- Subscribe
- Mute
- Subscribe to RSS Feed
- Permalink
- Report Inappropriate Content
Amd uProf 3900X
Hi,
I am trying to do a Process profiling using AMD's uProf. After stopping the process, the profiler gets stuck on "Processing Data..."
Anyone knows why this might be? Running latest version as of today
- Labels:
-
General
- Mark as New
- Bookmark
- Subscribe
- Mute
- Subscribe to RSS Feed
- Permalink
- Report Inappropriate Content
Hi spaceghost,
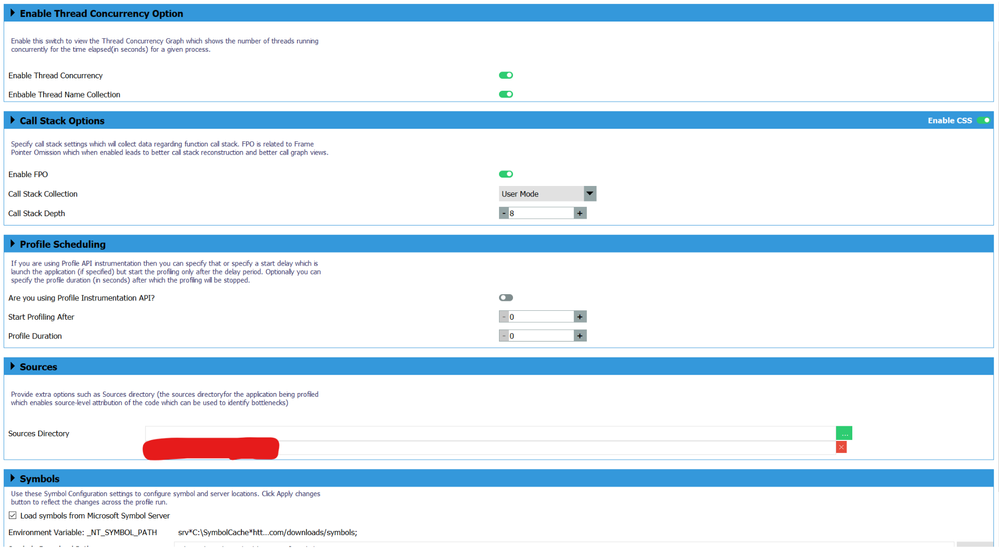
Can you provide more details about the OS, profiling type, profile configuration details? Was it a system wide profile? Was Callstack profiling enabled? What was the profiling duration?
Also check if the env var _NT_SYMBOL_PATH is set to any value?
~Swarup
- Mark as New
- Bookmark
- Subscribe
- Mute
- Subscribe to RSS Feed
- Permalink
- Report Inappropriate Content
Hi swarup,
Latest Windows 10, I am just using the default settings for the application and that doesn't work, I also tried other types of default profiles but still no luck. A system wide profile works. The profiling duration was 20 seconds, no callstacks, just default settings to profile a running app.
The PATH variable is set
- Mark as New
- Bookmark
- Subscribe
- Mute
- Subscribe to RSS Feed
- Permalink
- Report Inappropriate Content
Hi,
Can you try with the latest version - https://developer.amd.com/amd-uprof/
If the problem still persists, can you unset _NT_SYMBOL_PATH environment variable and check whether it is working or not?
- Mark as New
- Bookmark
- Subscribe
- Mute
- Subscribe to RSS Feed
- Permalink
- Report Inappropriate Content
I seriously don't understand what the issue is. The application runs fine when i start the profiling, with passed parameters i need for it.
But when it comes to Processing the data it just gets stuck doing it forever. It would be nice to get more information about the issue, or how long it has left until the analysis complete. Maybe i need to wait more than 10-20 minutes (before i give up) to complete the analysis? The recording is usually 1-2 minutes so not THAT long.
The CPU is idling, doesn't seem like it's doing anything too. Or the SSD...
Running on 3.2.225.0
- Mark as New
- Bookmark
- Subscribe
- Mute
- Subscribe to RSS Feed
- Permalink
- Report Inappropriate Content
Ok, it worked after a long waiting time.
- I would still like to have some sort of progress bar showing how much it has left (should not be hard to do at all, even if it's text only it would help out a lot)
- It seems like the CPU isn't utilized much, maybe make it so it can use more than what looks to be IDLE loads.
- Mark as New
- Bookmark
- Subscribe
- Mute
- Subscribe to RSS Feed
- Permalink
- Report Inappropriate Content
We will be adding the progress bar in the next release. Thanks for the suggestion.
- Mark as New
- Bookmark
- Subscribe
- Mute
- Subscribe to RSS Feed
- Permalink
- Report Inappropriate Content
Hi,
I have the same problem.
I'm on Windows 10. I haven't set the _NT_SYMBOL_PATH variable and disabled the download symbols option.
It gets stuck in processing data and I give up and close it.
How long did it take you to work?
Thanks
- Mark as New
- Bookmark
- Subscribe
- Mute
- Subscribe to RSS Feed
- Permalink
- Report Inappropriate Content
Hi dkapnopoulos,
The next version release of uProf will be out very soon. The new version should fix the issue observed by you. Please try this on the coming version and let us know if that helps.
Regards,
Swarup
- Mark as New
- Bookmark
- Subscribe
- Mute
- Subscribe to RSS Feed
- Permalink
- Report Inappropriate Content
Thank you! I'll check the new version as soon as is out
- Mark as New
- Bookmark
- Subscribe
- Mute
- Subscribe to RSS Feed
- Permalink
- Report Inappropriate Content
If the CPU is idling, it is most likely downloading the symbols from Microsoft Symbol Server, will you be able to try profiling with "Load symbols from Microsoft Symbol Server" option disabled and as well unsetting the _NT_SYMBOL_PATH variable ?
- Mark as New
- Bookmark
- Subscribe
- Mute
- Subscribe to RSS Feed
- Permalink
- Report Inappropriate Content
AMD uProf v3.3 has been released, which can be downloaded from https://developer.amd.com/amd-uprof/
Please try the issue on v3.3.
- Mark as New
- Bookmark
- Subscribe
- Mute
- Subscribe to RSS Feed
- Permalink
- Report Inappropriate Content
Hi,
congrats on the new release!
With the message log console I was able to see if uprof was stuck and managed to locate the problem.
On windows and with Visual Studio, it seems that uprof works fine if we set the linker option to "FULL" but gets stuck in processing data if we have set the linker option to "FASTLINK". Thus, I switched to full link and works fine!!
Can you check if there is any problem with fastlink? It's also the default option in Visual Studio
- Mark as New
- Bookmark
- Subscribe
- Mute
- Subscribe to RSS Feed
- Permalink
- Report Inappropriate Content
Hi dkapnopoulos,
Thanks for reporting your observation. Can you tell us which version/edition of Visual Studio you are using?
Regards,
Swarup
- Mark as New
- Bookmark
- Subscribe
- Mute
- Subscribe to RSS Feed
- Permalink
- Report Inappropriate Content
It's Visual Studio 2017. I don't remember exact version number though.


