- AMD Community
- Communities
- Radeon ProRender
- Blender Discussions
- AMD PR issue report - blender crash on render
Blender Discussions
- Subscribe to RSS Feed
- Mark Topic as New
- Mark Topic as Read
- Float this Topic for Current User
- Bookmark
- Subscribe
- Mute
- Printer Friendly Page
- Mark as New
- Bookmark
- Subscribe
- Mute
- Subscribe to RSS Feed
- Permalink
- Report Inappropriate Content
AMD PR issue report - blender crash on render
Hello AMD, I am picking blender back up after a few years away from it and am trying to work exclusively with blender 2.80 with eGPU running on Mac with Radeon Pro WX 7100. Since rendering options are limited, I decided to participate in random bug reporting while the ProRender add-on for Blender 2.80 is in development/testing. Not sure how often I'll have opportunities to post but hope this is helpful.
I will likely continued testing with the same blend file until a version of PR passes all my render tests and then movie onto a new file for testing. Note, I will have CPU rendering off and only attempt GPU rendering with all tests. With this first test, viewport rendering works, image rendering fails. Details below and attached. Hope this is helpful!
Regards, Tom
SYSTEM:
OS: OSX 10.14.3
Software: Blender 2.80 (2.80 2019-02-08, Blender Foundation)
ProRender version: 2.0.1
Test Blender File:
pyramid.blend01.blend
GPU Setup:
EGPU Chassis: Razer Core X
eGPU: AMD Radeon Pro WX 7100 (Metal)
AMD PR RESULTS:
Viewport - render worked
Render Image - crashes blender within ~1-2 seconds
- Mark as New
- Bookmark
- Subscribe
- Mute
- Subscribe to RSS Feed
- Permalink
- Report Inappropriate Content
Interesting. So viewport rendering works fine but not final image rendering? This is the opposite of some reports.
- Mark as New
- Bookmark
- Subscribe
- Mute
- Subscribe to RSS Feed
- Permalink
- Report Inappropriate Content
Correct, the viewport renders, rendering image crashes. I've attached two brief videos to demonstrate. One note, since testing this morning, I noticed blender had an update this am, so this reply was done using "blender-2.80.0-git20190222.9541ce2c261b-x86_64".
links to videos:
Viewport Success - https://inspiromedia.com/blend_tests/IMG_6083.MOV
Image Render Crash - https://inspiromedia.com/blend_tests/IMG_6082.MOV
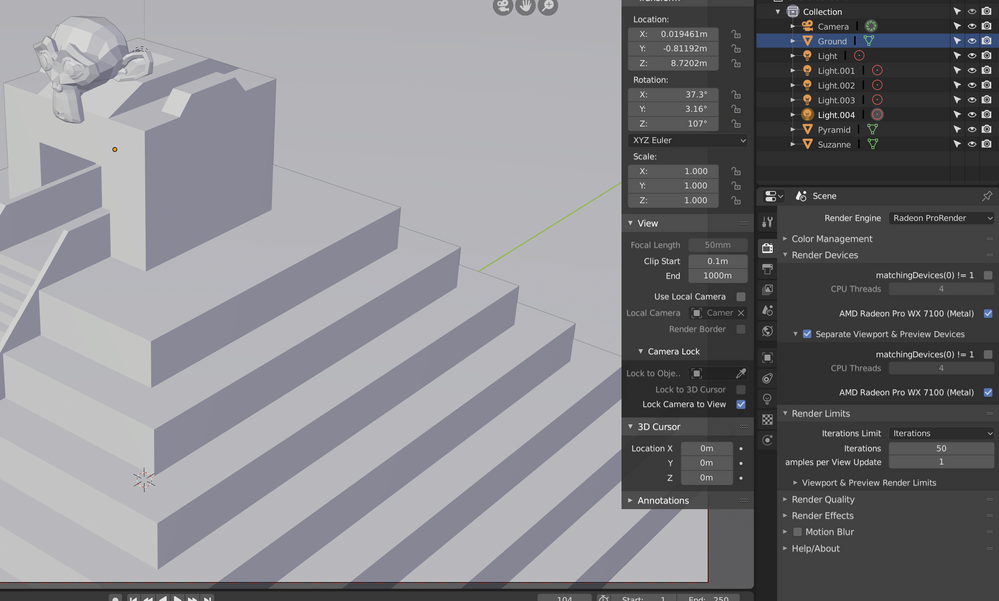
Screenshot with settings used.
- Mark as New
- Bookmark
- Subscribe
- Mute
- Subscribe to RSS Feed
- Permalink
- Report Inappropriate Content
MBP15 with dGPU 560. Blender 2.8 beta. RPR 2.0.1
CPU + dGPU enabled:
Final render: works (image is bright and clear).
Interactive render: works for 1-2 seconds then crashes but the image is very dark in comparison to the final render.
Exception Type: EXC_CRASH (SIGSEGV)
Exception Codes: 0x0000000000000000, 0x0000000000000000
Exception Note: EXC_CORPSE_NOTIFY
Termination Signal: Segmentation fault: 11
Termination Reason: Namespace SIGNAL, Code 0xb
Terminating Process: blender
# Blender 2.80 (sub 45), Commit date: 2019-02-20 15:09, Hash ee7c9790a254
bpy.data.screens["Layout"].shading.type = 'RENDERED' # Property
# backtrace
0 blender 0x0000000105268e67 BLI_system_backtrace + 55
1 blender 0x00000001046e2a7a sig_handle_crash + 362
2 libsystem_platform.dylib 0x00007fff7a685b3d _sigtramp + 29
3 ??? 0x0000700010dc4dc0 0x0 + 123145585184192
4 AMDMTLBronzeDriver 0x00007fff43428f7d -[BronzeMtlComputeCmdEncoder dispatchThreadgroups:threadsPerThreadgroup:] + 190
5 libTahoe64.dylib 0x000000011a3318ea _ZN3adl15DeviceMetalImpl8dispatchEPKNS_8LauncherE7MTLSizeS4_ + 346
6 libTahoe64.dylib 0x000000011a3309ba _ZN3adl13LauncherMetal8launch2DEPNS_8LauncherEiiiiPNS_10SyncObjectERf + 186
7 libTahoe64.dylib 0x000000011a236a2f _ZN5Tahoe18RtGpuPathTraceImpl18directIlluminationEPKNS_18MaterialSystemBaseEPKNS_10WorldRTGpuENS_4int2ES7_RKS7_PKNS_15RayCastFuncBaseERN3adl13ThreadsToExecEPNSD_6BufferINS_3RayEEEPNSG_INS_3HitEEEPNSG_IiEEPNSG_INS_11ShadingDataEEESJ_SM_SO_SR_RKNS_18RtGpuAlgorithmBase12RenderTargetERKNS_6OptionEPNSG_INS_6float4EEE + 1247
8 libTahoe64.dylib 0x000000011a23c680 _ZN5Tahoe14RtGpuPathTrace18directIlluminationEPKNS_10WorldRTGpuERKNS_4int2ES6_S6_PKNS_15RayCastFuncBaseERN3adl13ThreadsToExecERKNS0_9IsectDataESF_RKNS_18RtGpuAlgorithmBase12RenderTargetERKNS0_7OptionsEPNSA_6BufferINS_6float4EEE + 96
9 libTahoe64.dylib 0x000000011a23a63f _ZN5Tahoe14RtGpuPathTrace10renderImplEPKNS_10WorldRTGpuENS_4int2ES4_S4_NS_18RtGpuAlgorithmBase12RenderTargetENS_6OptionEib + 2735
10 libTahoe64.dylib 0x000000011a2394f4 _ZN5Tahoe14RtGpuPathTrace6renderEPKNS_10WorldRTGpuENS_4int2ES4_S4_NS_18RtGpuAlgorithmBase12RenderTargetENS_6OptionE + 1380
11 libTahoe64.dylib 0x000000011a215dcd _ZN5Tahoe10WorldRTGpu6renderENS_4int2ES1_S1_NS_6OptionEb + 1325
12 libTahoe64.dylib 0x000000011a21694d _ZN5Tahoe10WorldRTGpu6renderENS_4int2ES1_PNS_15FrameBufferBaseENS_6OptionE + 461
13 libTahoe64.dylib 0x000000011a29bf8a _ZN5Tahoe17RenderContextNode6renderENS_4int2ES1_PNS_15FrameBufferBaseERj + 1050
14 libTahoe64.dylib 0x000000011a11ffab _ZN5Tahoe3Api6renderEiiiiPNS_4NodeE + 171
15 libTahoe64.dylib 0x000000011a147e93 _ZN5Tahoe8Renderer10RenderTileEjjjj + 1091
16 libTahoe64.dylib 0x000000011a147038 _ZN5Tahoe8Renderer6RenderEv + 88
17 libRadeonProRender64.dylib 0x0000000119a960e0 rprContextRender + 176
18 libffi.dylib 0x00007fff786f1f6c ffi_call_unix64 + 76
19 ??? 0x000000011d6fd2f0 0x0 + 4788835056
- Mark as New
- Bookmark
- Subscribe
- Mute
- Subscribe to RSS Feed
- Permalink
- Report Inappropriate Content
The AMD Pro Render for Blender 2.80+ (i'm running 2.82 now) is crashing on my system: AMD Ryzen 7 3700X and AMD Sapphire Pulse RX5700 XT.
It crashes on viewport rendering as well, actually that's where I've been getting all the crashes, since I wanted to preview the materials etc, and on rendering the passes it usually crashes halfway and freezes the whole system, only fixed by restarting the computer. Reports say only AMD cards are affected, and that nvidia users aren't having any problems at all.
I haven't yet tested the full image render, since I haven't reached that step yet. It's proving impossible to work with AMD PR right now with this card due to this huge stability issue, although it's amazing and has a lot of potential. I'd love to see this crash fixed so I could keep using it. Until then I'll have to do with Cycles.
