- AMD Community
- Communities
- Developers
- OpenGL & Vulkan
- Vulkan - Driver memory swap behavior
OpenGL & Vulkan
- Subscribe to RSS Feed
- Mark Topic as New
- Mark Topic as Read
- Float this Topic for Current User
- Bookmark
- Subscribe
- Mute
- Printer Friendly Page
- Mark as New
- Bookmark
- Subscribe
- Mute
- Subscribe to RSS Feed
- Permalink
- Report Inappropriate Content
Vulkan - Driver memory swap behavior
Hi!
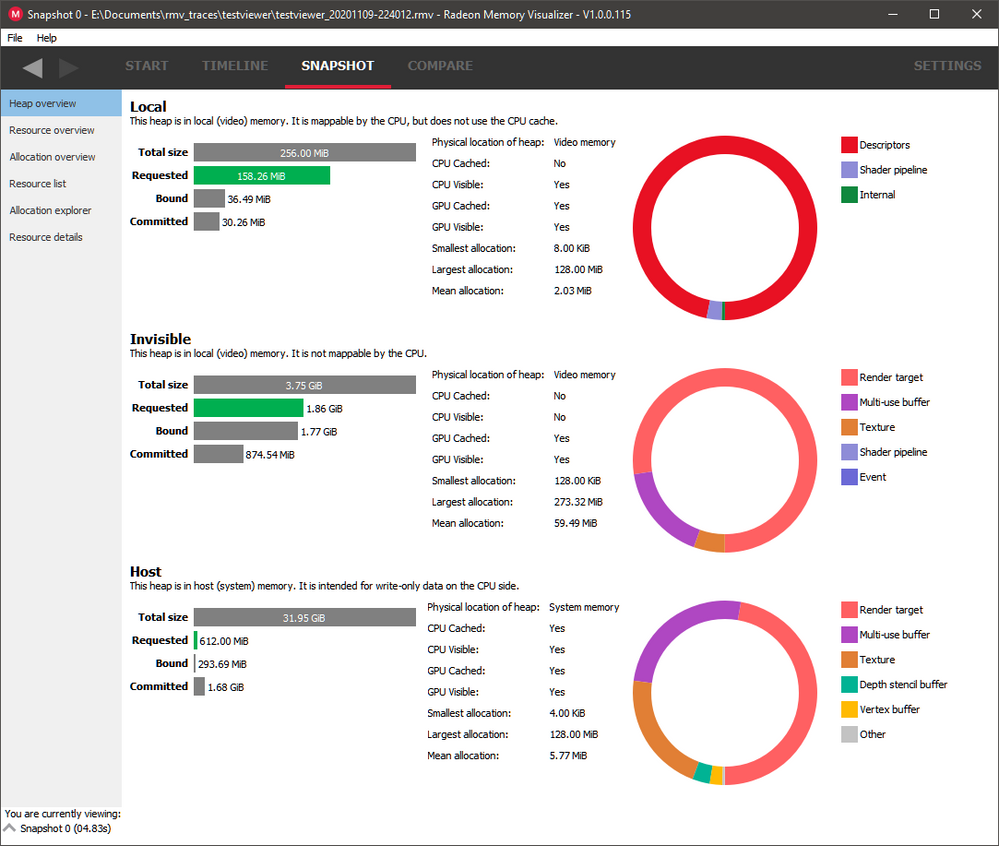
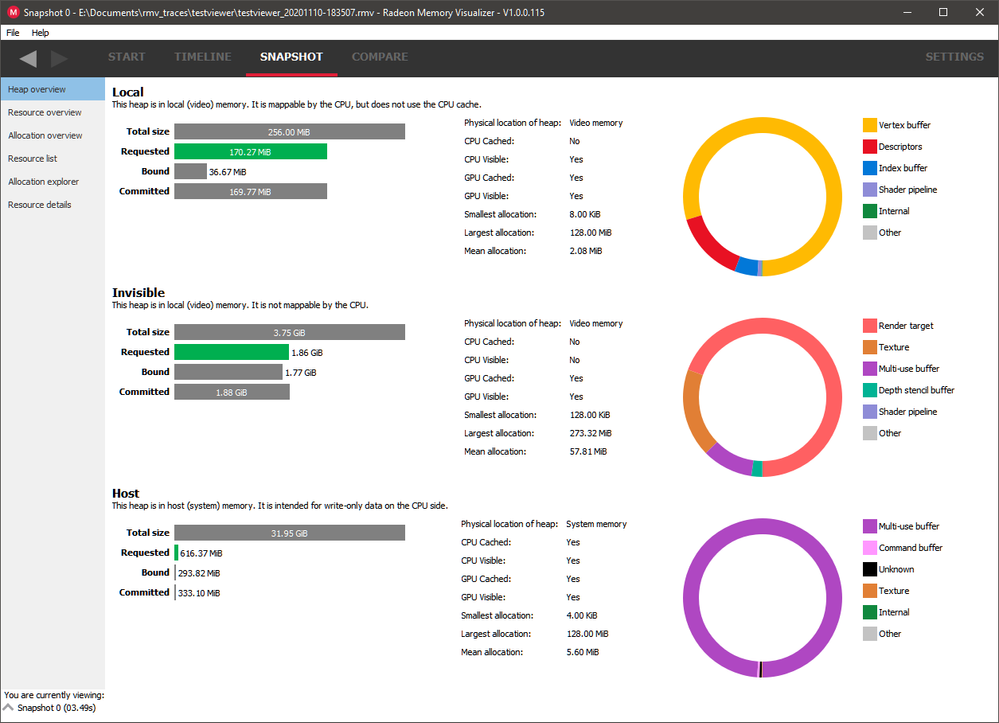
I have been running into some issues with my Vulkan app where it sometimes seems to swap out memory from the GPU making the application run extremely slowly, and it seems to be happening at random. I have run the RGP suite to try to figure out what is going wrong, and it seems to be related to memory! Operations on buffers and render targets can become extremely slow when their memory is swapped out and needs to paged in from host memory during a frame. I don't see the reason for why the driver needs to do this, because the memory is allocated as DEVICE_LOCAL, and I don't have any signs of over commitment or such like, nor do I exceed amount of allowed allocations. I can provide memory traces for both scenarios if needed, as well as the source code (although it is not small). A theory I have is that another application is taking GPU memory and for some reason the driver doesn't swap it's memory, but instead choose to swap from my app. These two images show the memory capture from the exact same app, with the exact same content, running on an Radeon RX 480. I have also had identical (or actually even worse) behavior on a Radeon R9 Nano. Both of which were running Windows 10 with an Adrenaline version from June as well as the most recent one (Driver Version
20.20.33.01-201016a-360073E-RadeonSoftwareAdrenalin2020)
- Mark as New
- Bookmark
- Subscribe
- Mute
- Subscribe to RSS Feed
- Permalink
- Report Inappropriate Content
Hi @Duttenheim
Thanks for your report. Could you please help provide a test which can reproduce this issue. 🙂
- Mark as New
- Bookmark
- Subscribe
- Mute
- Subscribe to RSS Feed
- Permalink
- Report Inappropriate Content
It's a bit hard for me to provide a consistent test which reproduces this problem, but I can provide a binary which should eventually produce the results presented in my original post. Another thing I could do is to provide memory and call traces, if that's going to be more useful instead? Or I could try to provide both :).
- Mark as New
- Bookmark
- Subscribe
- Mute
- Subscribe to RSS Feed
- Permalink
- Report Inappropriate Content
- Mark as New
- Bookmark
- Subscribe
- Mute
- Subscribe to RSS Feed
- Permalink
- Report Inappropriate Content
Hi again @dorisyan !
Sorry for the long delay, we have been working on the engine to make it easier to provide you with a binary and content, here's the link: https://github.com/gscept/nebula-test-content/blob/master/testviewer.zip
Just download, unzip and run, it should download the necessary content for you to start the app. You might also have to run the app several times, or do something in between runs to trigger this effect.
- Mark as New
- Bookmark
- Subscribe
- Mute
- Subscribe to RSS Feed
- Permalink
- Report Inappropriate Content
- Mark as New
- Bookmark
- Subscribe
- Mute
- Subscribe to RSS Feed
- Permalink
- Report Inappropriate Content
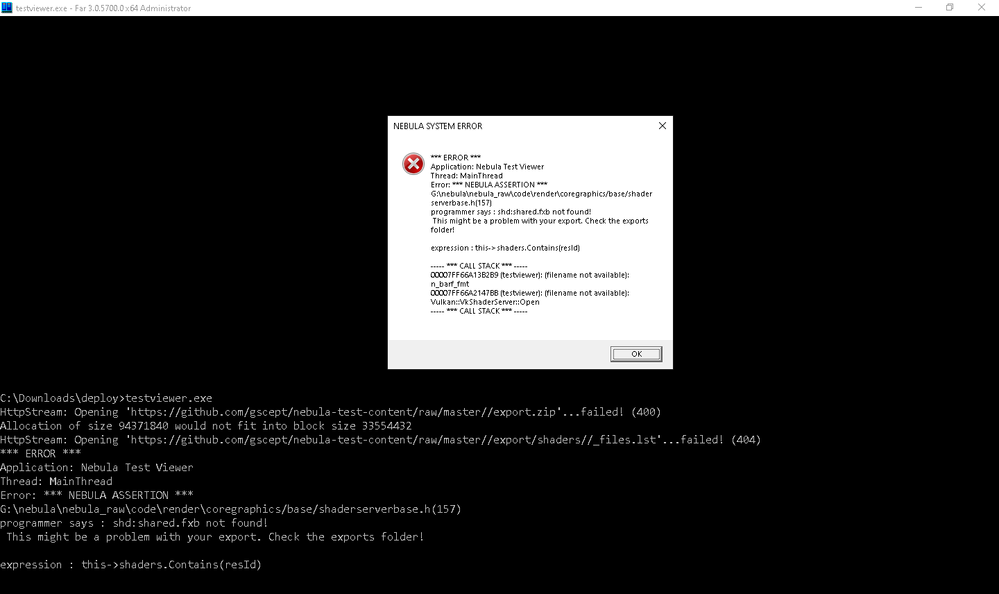
I see it failed to download the content zip, was the computer connected to the internet? To avoid submitting exported content with the code repo, we supply the content optionally through a HTTP stream. Perhaps a firewall issue?
- Mark as New
- Bookmark
- Subscribe
- Mute
- Subscribe to RSS Feed
- Permalink
- Report Inappropriate Content
Yes, I 'm using internet connections
>Perhaps a firewall issue?
I have not seen any message from Windows Firewall.
- Mark as New
- Bookmark
- Subscribe
- Mute
- Subscribe to RSS Feed
- Permalink
- Report Inappropriate Content
I am not sure what the issue is then. If you can enter the URL in your browser and download the content, you should be able to do it through the engine too. Otherwise, the only thing I can surmise is happening here is that the request gets blocked by your local network.
- Mark as New
- Bookmark
- Subscribe
- Mute
- Subscribe to RSS Feed
- Permalink
- Report Inappropriate Content
Thanks for your work! I will try to reproduce it soon 🙂
- Mark as New
- Bookmark
- Subscribe
- Mute
- Subscribe to RSS Feed
- Permalink
- Report Inappropriate Content
Thanks @dorisyan, any updates?
- Mark as New
- Bookmark
- Subscribe
- Mute
- Subscribe to RSS Feed
- Permalink
- Report Inappropriate Content
Hi @Duttenheim ,
Your app works well on my local machine, I'd like to how to trigger this bug stably?
- Mark as New
- Bookmark
- Subscribe
- Mute
- Subscribe to RSS Feed
- Permalink
- Report Inappropriate Content
It's a bit hard to trigger. It seems that when you have RenderDoc open with a capture and start another session, it causes the FPS to drop significantly, and after a while it seems this performance issue persists even if RenderDoc or the app is terminated. But when that starts happening, it doesn't stop until the system is rebooted.
Also sorry for not responding earlier, I did not see your comment before now 🙂


