Archives Discussions
- AMD Community
- Communities
- Developers
- Devgurus Archives
- Archives Discussions
- AMD APU limited to one module
- Subscribe to RSS Feed
- Mark Topic as New
- Mark Topic as Read
- Float this Topic for Current User
- Bookmark
- Subscribe
- Mute
- Printer Friendly Page
- Mark as New
- Bookmark
- Subscribe
- Mute
- Subscribe to RSS Feed
- Permalink
- Report Inappropriate Content
AMD APU limited to one module
Hi!
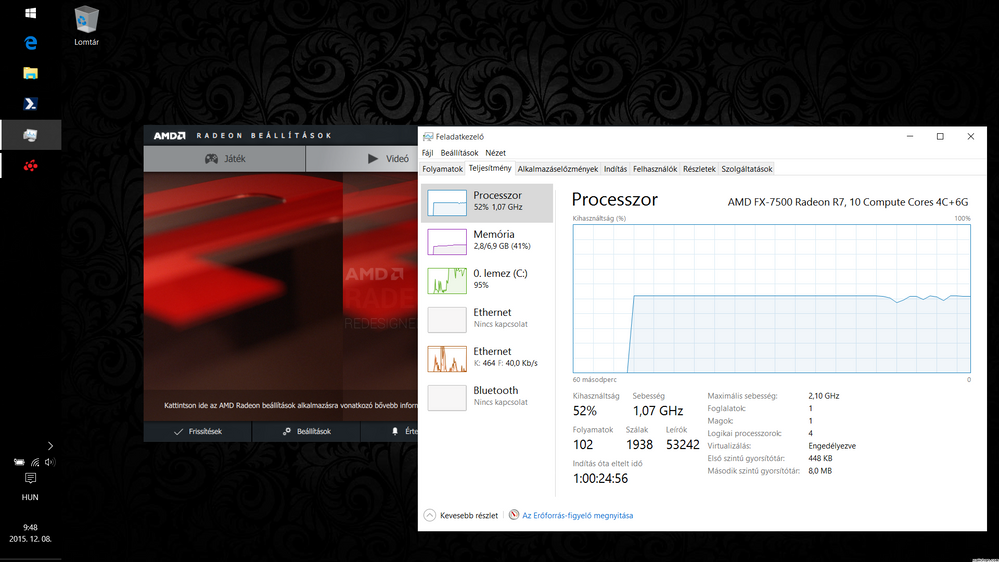
I have a Windows 10 64-bit installation on an AMD FX-7500, and for the past few weeks I have noticed that the machine uses only half the cores available to it. This is the machine booting from an SSD:
Usually both the SSD I/O queue and the CPU peak at nearly 100% when booting. CPU usage never goes above ~50%. The first level cache reported to be 448 KB is also a little troubling. The machine boots off power cord plugged in, running latest Catalyst as well as both Windows having set to Performance energy settings, as well as the installed Lenovo Energy Manager being set to Performance profile. I don't recall installing anything before I noticed this behavior.
Can anyone help me identifying the problem?
Solved! Go to Solution.
- Mark as New
- Bookmark
- Subscribe
- Mute
- Subscribe to RSS Feed
- Permalink
- Report Inappropriate Content
Indeed, it is triggering high-perf settings that are missing. When the clocks remain at 1.09 GHz, I unplug the power cable, wait a few seconds, plug it in again, and clocks rise to 2.37. It is definately the cause of triggers missing. Crimson should really take some alternate way of detecting when to go power saving and when to go perf, because the current way does not work, and has not worked for the past 4-5 years, at least on both my older ASUS and this Lenovo notebook.
- Mark as New
- Bookmark
- Subscribe
- Mute
- Subscribe to RSS Feed
- Permalink
- Report Inappropriate Content
How are you arriving at the conclusion that the OS is using only half the available CPU cores ? If its from the screenshot you posted ( language aside, I'm just looking at the image ), then I suggested you find some more meaningful metric to support that theory. Just because your CPU load ( that is actually what being displayed in that image ) is on average 50% does NOT mean that the OS is using half the processing resources. If simply means that the CPU load is 50%, if all cores is running half the load, then your system would display on average a 50% load. If 1/2 the cores are at full load (100%), then your system would also show an average of 50% load. I would suggest looking at individual core usage instead of overall usage to get a better view on whats going on.
- Mark as New
- Bookmark
- Subscribe
- Mute
- Subscribe to RSS Feed
- Permalink
- Report Inappropriate Content
I will check definately. Although again I do not know if let's say cores 1 and 2 are used, whether that refers to the two cores in a single module or two distinct modules.
The problem does not show on all reboots, but I have encountered it several times. I do not always check Task Manager, sometimes the machine just feels slow, so I pop it open and all applications can only saturate it to ~50%. I usually launch an OpenCL sample on CPU if I want to go for sure.
- Mark as New
- Bookmark
- Subscribe
- Mute
- Subscribe to RSS Feed
- Permalink
- Report Inappropriate Content
From what I can see in your screenshot your CPU is NOT the culprit. In fact, if you check carefully it says the CPU is running at only 1,07Ghz. You even aren't using half of your CPU power! What is troubling is that your hard drive is nearly 100% utilization. You are being bogged down by some process that is accessing disk. If you tried an SSD with your system it would fly...
It is some software or system component that is accessing disk a lot. Can be Windows maintenance, antivirus...
Maybe Process Explorer can help you pinpoint where is the problem.
- Mark as New
- Bookmark
- Subscribe
- Mute
- Subscribe to RSS Feed
- Permalink
- Report Inappropriate Content
Hi jvsala,
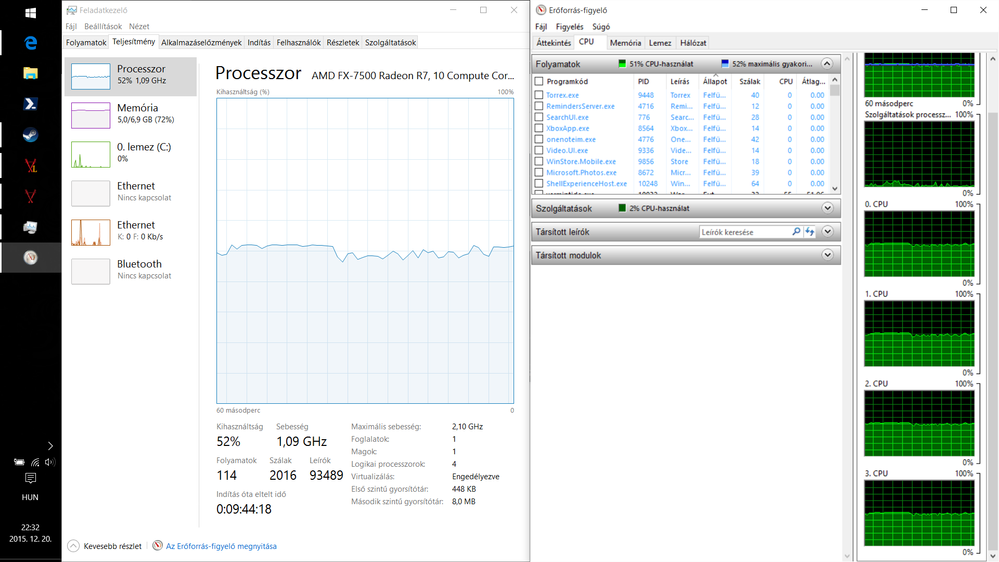
I managed to encounter the issue again. I created a screen of Resource Monitor while a game (Warhammer: Vermintide) was running. All 4 cores are running, all at 50%, and clock rates stay low. The game has been running for a while, but the air ain't that warm that comes out. I'll run CPU-Z some time to check temps, but I think it's not the problem.
- Mark as New
- Bookmark
- Subscribe
- Mute
- Subscribe to RSS Feed
- Permalink
- Report Inappropriate Content
I still don't see any problem. You said in your first post that half of your CPU was unused because it was somewhat limited to one module .That screenshot shows that isn't true. You are using all the cores. If you are asking just why your game doesn't run any faster is because:
- You hit your monitor's frame rate and have v-sync enabled, it doesn't make sense to use more power.
- Your GPU is limiting your performance, so the cores are underused.
What is your frame rate running the game?
Do you get more frames if you disable v-sync?
You can know if you are GPU limited by reducing resolution and detail to the minimun and checking if you have more FPS.
And finally, if you are obssessed with having your CPU cores at 100% full tilt you can just run Sandra benchmarks all day.
- Mark as New
- Bookmark
- Subscribe
- Mute
- Subscribe to RSS Feed
- Permalink
- Report Inappropriate Content
OK, let me try to clarify:
- I generally tend to turn off V-sync in all games, because the hardware is not the mighty. There steps between 20-25-30-45-60 FPS are too great for my taste. If my notebook could squeeze out ~60 FPS I'd have V-sync turned on all day, but tearing is less an issue than low framerates.
- The GPU is definately a limiting factor, but it is not the source of this issue.
Answering the questions:
- Did not check, somewhere around 7-15 FPS.
- All this in the lowest of settings and resolution. Increasing either hurts perf even more.
If everything goes well, the same settings produce 15-25 FPS, which is starting to become playable.
I've had clock rate issues with my older RoG (ASUS G73Jh) notebook as well. Catalyst occasionally failed to detect that the system is plugged in and remained on the same clock settings as on battery. This issue most often presented itself when putting the notebook to sleep on battery and waking it up on cord. This situation reminds me of those times all too much. My suspicion is only strengthened by another peculiar effect: sometimes the notebook fans rise to 100% for 20-30 minutes before dropping. CPU-IGP-dGPU load or thermal status absolutely does not justify this behavior. Microsoft Word and a few tabs in Edge with near idle CPU load cannot trigger such behavior. It's as if Crimson would think the notebook landed on some volcanic planet.
I'm not obsessed with CPU running at 100%, but when the very same issue persists under a sole instance of Visual Studio, and the compilation speed is most certainly below 50% of normal, then I start to become frustrated. I care far less for FPS then I do for template instantiation and FFT performance.
- Mark as New
- Bookmark
- Subscribe
- Mute
- Subscribe to RSS Feed
- Permalink
- Report Inappropriate Content
Indeed, it is triggering high-perf settings that are missing. When the clocks remain at 1.09 GHz, I unplug the power cable, wait a few seconds, plug it in again, and clocks rise to 2.37. It is definately the cause of triggers missing. Crimson should really take some alternate way of detecting when to go power saving and when to go perf, because the current way does not work, and has not worked for the past 4-5 years, at least on both my older ASUS and this Lenovo notebook.
- Mark as New
- Bookmark
- Subscribe
- Mute
- Subscribe to RSS Feed
- Permalink
- Report Inappropriate Content
Very interesting finding Meteorhead.
One of the things that occur to me is to change the energy settings so even if it detects battery you have always high performance mode and see what happens. When you are in battery it should drain a lot of energy but for testing could be interesting.
- Mark as New
- Bookmark
- Subscribe
- Mute
- Subscribe to RSS Feed
- Permalink
- Report Inappropriate Content
Playing with the energy settings does not make a difference. The Lenovo Energy Manager is tied to the Windows built-in settings (if I change one, the other changes too, so I guess they are alternate UIs to the same setting). Clock behavior is the same in both Performance Mode and in Balanced Mode.


