Archives Discussions
- AMD Community
- Communities
- Developers
- Devgurus Archives
- Archives Discussions
- Incorrect Zero-copy mapping time stamps
- Subscribe to RSS Feed
- Mark Topic as New
- Mark Topic as Read
- Float this Topic for Current User
- Bookmark
- Subscribe
- Mute
- Printer Friendly Page
- Mark as New
- Bookmark
- Subscribe
- Mute
- Subscribe to RSS Feed
- Permalink
- Report Inappropriate Content
Incorrect Zero-copy mapping time stamps
Hi Raistmer
Are you saying you pass CL_MAP_READ|CL_MAP_WRITE to clEnqueueMapBuffer but profiler shows only CL_MAP_READ in API trace? I could not reproduce this bug.
With regard to the driver, can you download the latest catalyst driver (http://support.amd.com/us/gpudownload/windows/Pages/radeonaiw_vista64.aspx) and try to install it. The driver package is generic. You can also try preview version of the driver which doesn't do device ID check.
If possible, can you please share your executable so we can verify the zero copy timestamps problem.
Here's the link to submit your program
- Mark as New
- Bookmark
- Subscribe
- Mute
- Subscribe to RSS Feed
- Permalink
- Report Inappropriate Content
First of all, thanks a lot for the link to correct driver package. Now I have Cat 12.8 on C-60 netbook to try.
I will play a little with new driver to estimate changes in performance and then will re-do profiler runs. If strange results will be here still, then will try SDK sample and send binary for your investigation. Will report later.
- Mark as New
- Bookmark
- Subscribe
- Mute
- Subscribe to RSS Feed
- Permalink
- Report Inappropriate Content
Unfortunately, can't say anything good about Catalyst 12.8 so far...
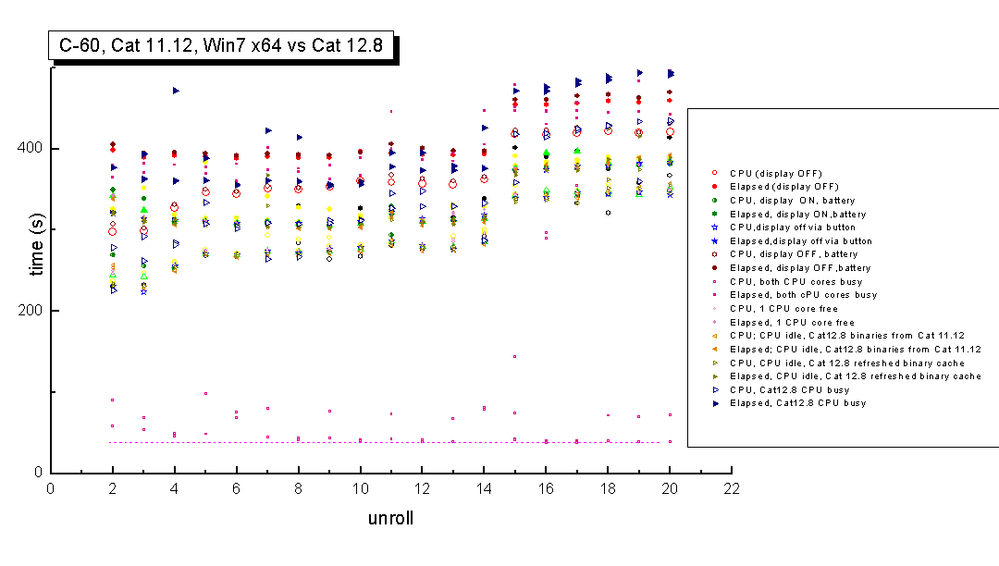
With free CPU cores overall performance stayed the same as with Catalyst 11.12, but with busy CPU cores performance became even worse than before... It's long standing issue with recent catalyst drivers: when CPU cores busy, even with idle-priority precesses, GPU usage drops erratically and strong. App execution times increase considerably, even if app CPU priority rised to above normal.
But on C-60 with Cat 11.12 I saw big decrease in consumed CPU time on busy CPU. This compensated GPU performance drop ( cause another app used more CPU time for good cause). With Catalyst 12.8 overall performance on busy CPU drops still, but there is no drop in CPU consumption, CPU consumption remains very high, almost whole CPU core remains occupied (for GPU app!!!).
To illustrate this I post performance picture for my app (along X axis some parameter that increase kernel some kernel domain size inside app). Look how increase Elapsed and CPU times after switching to Catalyst 12.8. The same app binary used for all tests...
- Mark as New
- Bookmark
- Subscribe
- Mute
- Subscribe to RSS Feed
- Permalink
- Report Inappropriate Content
Well, I tried under Catalyst 12.8, no good...
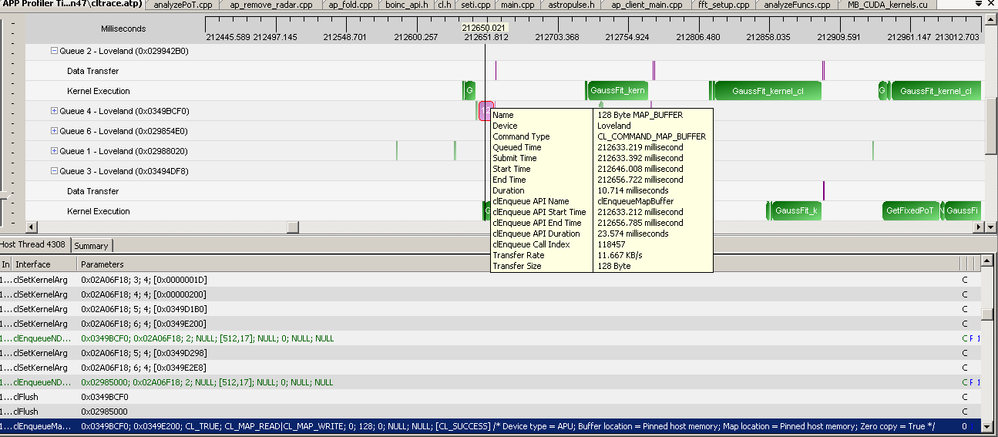
1. APP Profiler shows correct flags now, both read and write (look picture).
2. But incorrect timings still here. Look on picture, line at bottom describes selected map operation.
One can see it's true zero copy one (as I expected it should be). But what time it has?: ~10 milliseconds ![]()
Too long for zero copy, right... So, I thins this part of APP Profiler requires improvement too. Data is unreliable. Together with unreliable time stamps for kernels executed in different queues I'm afraid, it makes whole picture too unreliable to base any performance investigations on it ![]() . Hope this will be vastly improved in next releases.
. Hope this will be vastly improved in next releases.
For now I will send binary along with input data to you via tour link and will try SDK sample.


