Server Gurus Discussions
- AMD Community
- Communities
- Server Gurus
- Server Gurus Discussions
- uprof filling up 100+GB space on system partion an...
- Subscribe to RSS Feed
- Mark Topic as New
- Mark Topic as Read
- Float this Topic for Current User
- Bookmark
- Subscribe
- Mute
- Printer Friendly Page
- Mark as New
- Bookmark
- Subscribe
- Mute
- Subscribe to RSS Feed
- Permalink
- Report Inappropriate Content
uprof filling up 100+GB space on system partion and take hours to process data
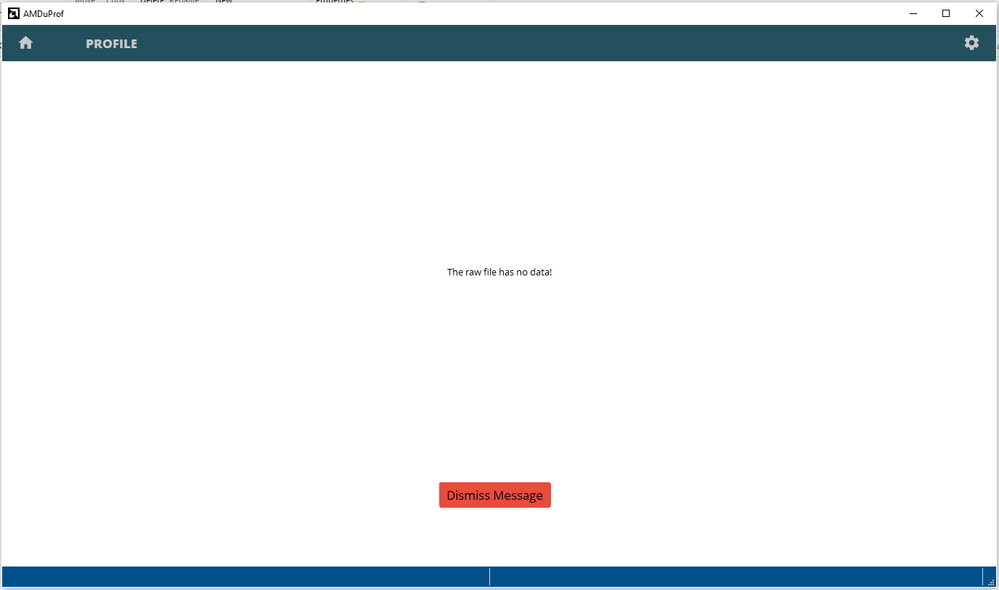
I was doing "assess performance extended" on a game which at the end records about 15 minutes of trace. After the recording ends uprof gradually filled up the entire partition C(which has about 150GB free space). It's also very likely to fail at the end, but when it succeeded the end result is only 13GB all files combined. Is this normal? Should I reduce the test time or it's only a bug?
The cpu is 5800X and there are 32GB of DDR4-3200 memory.
Thank you.
- Mark as New
- Bookmark
- Subscribe
- Mute
- Subscribe to RSS Feed
- Permalink
- Report Inappropriate Content
Hi @111alan ,
The profile data file size depends on various factors. You may try the following options to reduce the profile data size.
- Select profile target as "Application" or "Process".
- Disable "Collect System Wide Data" option.
- Assess performance extended includes 14 events. You may choose a config with lesser events ("assess performance") or go for custom config by choosing lesser number of events, may be 2 to 3 events.
- For initial few profiling, you may disable CSS to reduce profile data.
To profile only for 15mins, you can choose profile target as Process and select the gaming app. Choose Profile Duration to 900 seconds. This settings would capture 15mins of profile data once the profiling started. Also, you can choose 'Stop' button to stop the profiling.
Let us know if the above steps could help you or not.
- Mark as New
- Bookmark
- Subscribe
- Mute
- Subscribe to RSS Feed
- Permalink
- Report Inappropriate Content
Thanks. I'm trying if I can reduce the number of counters and still preserve the cache hit rate, br misprediction rate and CPI data I want. But I didn't remember it using hundreds of GB each time in the last version?
Is it possible to get those large temporary files to store on a different disk partition? I chose the raw/translated file save location but uprof still fills up the system partition when it's translating data.
BTW the save location will reset back to %appdata% each time uprof restarts. I think this is a bug because uprof on two of my systems both have this issue.
Thank you for your help.
- Mark as New
- Bookmark
- Subscribe
- Mute
- Subscribe to RSS Feed
- Permalink
- Report Inappropriate Content
Hi @111alan ,
Using 'Custom Profile' config, you should be able to select desired events or you may choose 'Investigate Branching' config. Let us know the uProf version you are using.
Regarding the save location issue, I will forward it to the team to look into it.
Let us know if reducing the number of events helped or not.


