Server Gurus Discussions
- AMD Community
- Communities
- Server Gurus
- Server Gurus Discussions
- Re: AMDuProf not attaching to processes on Linux
- Subscribe to RSS Feed
- Mark Topic as New
- Mark Topic as Read
- Float this Topic for Current User
- Bookmark
- Subscribe
- Mute
- Printer Friendly Page
- Mark as New
- Bookmark
- Subscribe
- Mute
- Subscribe to RSS Feed
- Permalink
- Report Inappropriate Content
AMDuProf not attaching to processes on Linux
This was working a few days ago but I updated my OS and some libraries along with it. Glibc, gcc, xorg, etc.
I tried running uProf 4.0.341 and it does not attach to processes - "the driver failed to start profiling. (error code 0x80004005)"
- Mark as New
- Bookmark
- Subscribe
- Mute
- Subscribe to RSS Feed
- Permalink
- Report Inappropriate Content
Hello,
Can you explain the issue in more details so that I could reproduce this on my machine here?
- Mark as New
- Bookmark
- Subscribe
- Mute
- Subscribe to RSS Feed
- Permalink
- Report Inappropriate Content
I'm facing the same issue on Fedora 37 with Linux:
"ERROR : The driver failed to start profiling. (error code 0x80004005)"
- Mark as New
- Bookmark
- Subscribe
- Mute
- Subscribe to RSS Feed
- Permalink
- Report Inappropriate Content
Hi, I tried reproducing this on our end here but could not. Can you please elaborate more on what exactly you are doing... that would help us reproduce the issue and help you use uProf successfully?
- Mark as New
- Bookmark
- Subscribe
- Mute
- Subscribe to RSS Feed
- Permalink
- Report Inappropriate Content
I'm facing the same issue on Fedora Silverblue 37. Any process I attach to or start profiling from uprof give me "The driver failed to start profiling. (error code 0x80004005)" screen. Same problem runnning sudo.
AMDuProf_Linux_x64_4.0.341.tar.bz2
Linux fedora37.fedora 6.0.15-300.fc37.x86_64
- Mark as New
- Bookmark
- Subscribe
- Mute
- Subscribe to RSS Feed
- Permalink
- Report Inappropriate Content
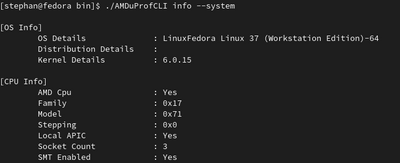
Can you share the output of below command:
AMDuProfCLI.exe info --system
- Mark as New
- Bookmark
- Subscribe
- Mute
- Subscribe to RSS Feed
- Permalink
- Report Inappropriate Content
This just gives the following error:
[stephan@fedora bin]$ ./AMDuProfCLI --system
ERROR: Invalid option or missing command.
Please note that executables on linux don't have an ".exe" extension
- Mark as New
- Bookmark
- Subscribe
- Mute
- Subscribe to RSS Feed
- Permalink
- Report Inappropriate Content
[OS Info]
OS Details : LinuxFedora Linux 37.20230104.0 (Silverblue)-64
Distribution Details :
Kernel Details : 6.0.15
[CPU Info]
AMD Cpu : Yes
Family : 0x19
Model : 0x21
Stepping : 0x0
Local APIC : Yes
Socket Count : 2
SMT Enabled : Yes
Threads per Core : 2
Threads per CCX : 16
Threads per Package : 16
Total number of Threads : 32
[PERF Features Availability]
Core PMC : Yes
L3 PMC : Yes
DF PMC : Yes
PERF TS : No
[IBS Features Availability]
IBS : Yes
IBS Fetch Sampling : Yes
IBS OP Sampling : Yes
IBS FetchCtlExtd : Yes
IBS ExtCount : Yes
IBS Dispatch : Yes
IBS BrTgtAddr : Yes
IBS OpData4 : No
[RAPL/CEF Features Availability]
RAPL : Yes
APERF & MPERF : Yes
Read Only APERF & MPERF : Yes
IRPERF : Yes
HW P-State Control : Yes
[PERF features supported by OS]
TBP Supported : Yes
EBP Supported : Yes
IBS Supported : Yes
IRPERF Supported : Yes
APERF Supported : Yes
MPERF Supported : Yes
BPF Supported : No
BCC Installed : No
Perf Event Paranoid : 2
Perf Event Max Mlock : 516 KB
Perf Event Max Stack : 127
[Hypervisor Info]
Hypervisor Enabled : No
- Mark as New
- Bookmark
- Subscribe
- Mute
- Subscribe to RSS Feed
- Permalink
- Report Inappropriate Content
Thanks for the info. I am working on to reproduce this issue. I will keep you posted on this.
- Mark as New
- Bookmark
- Subscribe
- Mute
- Subscribe to RSS Feed
- Permalink
- Report Inappropriate Content
I could not find the build you used, but i could not reproduce the issue with Rawhide.20230112.n.0 (Silverblue Prerelease)-64. Let me know if can test this or any other build which we both can use.
- Mark as New
- Bookmark
- Subscribe
- Mute
- Subscribe to RSS Feed
- Permalink
- Report Inappropriate Content
This just happens for the regular latest stable linux release of AMDuProf (AMDuProf_Linux_x64_4.0.341). Just go the downloads section😅
- Mark as New
- Bookmark
- Subscribe
- Mute
- Subscribe to RSS Feed
- Permalink
- Report Inappropriate Content
I tried to reproduce the problem you reported with latest fedora build, build i could not reproduce it. I tried below build.
Can you try the latest build of Fedora and see if you still see the issue?
- Mark as New
- Bookmark
- Subscribe
- Mute
- Subscribe to RSS Feed
- Permalink
- Report Inappropriate Content
I don't know which Fedora you have installed. It should just show something like "LinuxFedora Linux 37":
- Mark as New
- Bookmark
- Subscribe
- Mute
- Subscribe to RSS Feed
- Permalink
- Report Inappropriate Content
Hi, I think I have reproduced the issue - i will keep you posted on this work here. Can you try to profile the application in the same terminal as your application is running?
- Mark as New
- Bookmark
- Subscribe
- Mute
- Subscribe to RSS Feed
- Permalink
- Report Inappropriate Content
Hi, I could not reproduce the issue you reported. Do you think we can meet online and discuss the issue? drop an email to toolchainsuppot at amd dot com and we shall work together to understand/resolve the issue.
- Mark as New
- Bookmark
- Subscribe
- Mute
- Subscribe to RSS Feed
- Permalink
- Report Inappropriate Content
I can reproduce this in Fedora 37 using the latest RPM
- Mark as New
- Bookmark
- Subscribe
- Mute
- Subscribe to RSS Feed
- Permalink
- Report Inappropriate Content
Hi
I am not able to reproduce this issue on my fedora 37 instance
Can you please share the steps on how you have installed Fedora 37 along with the command used for attaching to the process.
Best Regards
Hemanth
- Mark as New
- Bookmark
- Subscribe
- Mute
- Subscribe to RSS Feed
- Permalink
- Report Inappropriate Content
Hello
Can you please share additional information which can help me in reproducing the error
Steps used for Fedora Installation
Fedora Edition(Server, Workstation, Silverblue)
Command used for Profiling
whether issue is observed in CLI or GUI
Application used for profiling
Best Regards
Hemanth
- Mark as New
- Bookmark
- Subscribe
- Mute
- Subscribe to RSS Feed
- Permalink
- Report Inappropriate Content
Never got any notifications for this, sorry.
Much like the others
- grab what's available on the Downloads page
- run "./AMDuProf" (GUID)
- select "Profile running Process(es)"
- get the error
Still getting it today.
- Mark as New
- Bookmark
- Subscribe
- Mute
- Subscribe to RSS Feed
- Permalink
- Report Inappropriate Content
Hello zlice
I am unable to reproduce this issue at my end on Fedora 37, can we meet online to help us understand the issue better.
Can you please drop an email to toolchainsupport@amd.com with your preferred date/time
Best Regards
Hemanth
- Mark as New
- Bookmark
- Subscribe
- Mute
- Subscribe to RSS Feed
- Permalink
- Report Inappropriate Content
Possibly, I'm not sure when I will be available. I tried making another post but think it wasn't sent because the previous was waiting approval?
This id the ldd of uprof for me. Not sure if anything sticks out for system libraries.
ldd AMDuProf-bin  | grep -v home
	linux-vdso.so.1 (0x00007ffe4f781000)
	libpthread.so.0 => /usr/lib/libpthread.so.0 (0x00007f99a77ab000)
	libstdc++.so.6 => /usr/lib/libstdc++.so.6 (0x00007f99a054e000)
	libm.so.6 => /usr/lib/libm.so.6 (0x00007f99a671e000)
	libgcc_s.so.1 => /usr/lib/libgcc_s.so.1 (0x00007f99a778b000)
	libc.so.6 => /usr/lib/libc.so.6 (0x00007f99a0365000)
	librt.so.1 => /usr/lib/librt.so.1 (0x00007f99a7784000)
	libz.so.1 => /usr/lib/libz.so.1 (0x00007f99a776a000)
	libdl.so.2 => /usr/lib/libdl.so.2 (0x00007f99a7765000)
	libgthread-2.0.so.0 => /usr/lib/libgthread-2.0.so.0 (0x00007f99a7760000)
	libglib-2.0.so.0 => /usr/lib/libglib-2.0.so.0 (0x00007f99a62bc000)
	/lib64/ld-linux-x86-64.so.2 => /usr/lib64/ld-linux-x86-64.so.2 (0x00007f99a77da000)
	libGL.so.1 => /usr/lib/libGL.so.1 (0x00007f99a6697000)
	libfontconfig.so.1 => /usr/lib/libfontconfig.so.1 (0x00007f99a6fb5000)
	libfreetype.so.6 => /usr/lib/libfreetype.so.6 (0x00007f99a5546000)
	libX11.so.6 => /usr/lib/libX11.so.6 (0x00007f99a50bd000)
	libX11-xcb.so.1 => /usr/lib/libX11-xcb.so.1 (0x00007f99a7759000)
	libXi.so.6 => /usr/lib/libXi.so.6 (0x00007f99a7743000)
	libSM.so.6 => /usr/lib/libSM.so.6 (0x00007f99a0000000)
	libICE.so.6 => /usr/lib/libICE.so.6 (0x00007f99a6679000)
	libxcb.so.1 => /usr/lib/libxcb.so.1 (0x00007f99a6292000)
	libdbus-1.so.3 => /usr/lib/libdbus-1.so.3 (0x00007f99a623c000)
	libpcre2-8.so.0 => /usr/lib/libpcre2-8.so.0 (0x00007f99a5967000)
	libGLdispatch.so.0 => /usr/lib/libGLdispatch.so.0 (0x00007f99a548f000)
	libGLX.so.0 => /usr/lib/libGLX.so.0 (0x00007f99a4bce000)
	libexpat.so.1 => /usr/lib/libexpat.so.1 (0x00007f99a2dcf000)
	libbz2.so.1 => /usr/lib/libbz2.so.1 (0x00007f99a50aa000)
	libpng16.so.16 => /usr/lib/libpng16.so.16 (0x00007f99a2d99000)
	libbrotlidec.so.1 => /usr/lib/libbrotlidec.so.1 (0x00007f99a5959000)
	libXext.so.6 => /usr/lib/libXext.so.6 (0x00007f99a4bb9000)
	libuuid.so.1 => /usr/lib/libuuid.so.1 (0x00007f99a6670000)
	libXau.so.6 => /usr/lib/libXau.so.6 (0x00007f99a6fb0000)
	libXdmcp.so.6 => /usr/lib/libXdmcp.so.6 (0x00007f99a6234000)
libbrotlicommon.so.1 => /usr/lib/libbrotlicommon.so.1 (0x00007f99a2d76000)- Mark as New
- Bookmark
- Subscribe
- Mute
- Subscribe to RSS Feed
- Permalink
- Report Inappropriate Content
Launching the same way everyone else is:
- Download tar from latest page (rpm gives same results)
- ./AMDuProf
- attach to process
- error
Doing `ldd AMDuProf-bin |grep -v home` Gives me these libraries that uProf is linked to. Something with libraries are my first guess.
linux-vdso.so.1 (0x00007ffe0e552000)
libpthread.so.0 => /usr/lib/libpthread.so.0 (0x00007f53f98b3000)
libstdc++.so.6 => /usr/lib/libstdc++.so.6 (0x00007f53f254e000)
libm.so.6 => /usr/lib/libm.so.6 (0x00007f53f97d1000)
libgcc_s.so.1 => /usr/lib/libgcc_s.so.1 (0x00007f53f97b1000)
libc.so.6 => /usr/lib/libc.so.6 (0x00007f53f2365000)
librt.so.1 => /usr/lib/librt.so.1 (0x00007f53f97aa000)
libz.so.1 => /usr/lib/libz.so.1 (0x00007f53f9790000)
libdl.so.2 => /usr/lib/libdl.so.2 (0x00007f53f978b000)
libgthread-2.0.so.0 => /usr/lib/libgthread-2.0.so.0 (0x00007f53f9786000)
libglib-2.0.so.0 => /usr/lib/libglib-2.0.so.0 (0x00007f53f86bc000)
/lib64/ld-linux-x86-64.so.2 => /usr/lib64/ld-linux-x86-64.so.2 (0x00007f53f98e2000)
libGL.so.1 => /usr/lib/libGL.so.1 (0x00007f53f8379000)
libfontconfig.so.1 => /usr/lib/libfontconfig.so.1 (0x00007f53f9739000)
libfreetype.so.6 => /usr/lib/libfreetype.so.6 (0x00007f53f82bf000)
libX11.so.6 => /usr/lib/libX11.so.6 (0x00007f53f74bd000)
libX11-xcb.so.1 => /usr/lib/libX11-xcb.so.1 (0x00007f53f8ffb000)
libXi.so.6 => /usr/lib/libXi.so.6 (0x00007f53f8fe5000)
libSM.so.6 => /usr/lib/libSM.so.6 (0x00007f53f2000000)
libICE.so.6 => /usr/lib/libICE.so.6 (0x00007f53f8fc7000)
libxcb.so.1 => /usr/lib/libxcb.so.1 (0x00007f53f8692000)
libdbus-1.so.3 => /usr/lib/libdbus-1.so.3 (0x00007f53f8269000)
libpcre2-8.so.0 => /usr/lib/libpcre2-8.so.0 (0x00007f53f7967000)
libGLdispatch.so.0 => /usr/lib/libGLdispatch.so.0 (0x00007f53f7149000)
libGLX.so.0 => /usr/lib/libGLX.so.0 (0x00007f53f8237000)
libexpat.so.1 => /usr/lib/libexpat.so.1 (0x00007f53f748c000)
libbz2.so.1 => /usr/lib/libbz2.so.1 (0x00007f53f867f000)
libpng16.so.16 => /usr/lib/libpng16.so.16 (0x00007f53f7113000)
libbrotlidec.so.1 => /usr/lib/libbrotlidec.so.1 (0x00007f53f8fb1000)
libXext.so.6 => /usr/lib/libXext.so.6 (0x00007f53f70fe000)
libuuid.so.1 => /usr/lib/libuuid.so.1 (0x00007f53f8676000)
libXau.so.6 => /usr/lib/libXau.so.6 (0x00007f53f8671000)
libXdmcp.so.6 => /usr/lib/libXdmcp.so.6 (0x00007f53f795f000)
libbrotlicommon.so.1 => /usr/lib/libbrotlicommon.so.1 (0x00007f53f70db000)- Mark as New
- Bookmark
- Subscribe
- Mute
- Subscribe to RSS Feed
- Permalink
- Report Inappropriate Content
Hello zlice
We are unable to reproduce the issue at our end.
Please drop an email to toolchainsupport@amd.com with your preferred time to meet and understand the issue better.
Best Regards
Hemanth
- Mark as New
- Bookmark
- Subscribe
- Mute
- Subscribe to RSS Feed
- Permalink
- Report Inappropriate Content
I sent an e-mail the other day but did not hear back. Is there anything special I should add to the title?
FYI, I will be gone next week.
- Mark as New
- Bookmark
- Subscribe
- Mute
- Subscribe to RSS Feed
- Permalink
- Report Inappropriate Content
Hello zlice
we haven't received your email. Nothing special needs to be added to the title/subject.
Can you please send it again to toolchainsupport@amd.com with your preferred date and time to meet online
Best Regards
Hemanth
- Mark as New
- Bookmark
- Subscribe
- Mute
- Subscribe to RSS Feed
- Permalink
- Report Inappropriate Content
Will send a new e-mail in a week or so. Thanks.
- Mark as New
- Bookmark
- Subscribe
- Mute
- Subscribe to RSS Feed
- Permalink
- Report Inappropriate Content
Sent an e-mail
- Mark as New
- Bookmark
- Subscribe
- Mute
- Subscribe to RSS Feed
- Permalink
- Report Inappropriate Content
I have not seen a reply e-mail in my Inbox or Spam. I'm guessing they aren't getting through.
- Mark as New
- Bookmark
- Subscribe
- Mute
- Subscribe to RSS Feed
- Permalink
- Report Inappropriate Content
I have the exact same issue on arch on the 6.1.27-1-lts kernel with the amduprof env module loaded and uprof version 4.0.341.0.
The cpu is a ryzen 5800x in case the bug is arcane enough for this to matter.
- Mark as New
- Bookmark
- Subscribe
- Mute
- Subscribe to RSS Feed
- Permalink
- Report Inappropriate Content
Hello rriesen
I have tried with 6.1.27 kernel I was unable to reproduce the issue at our end.
Please drop an email to toolchainsupport@amd.com with your preferred time to meet and understand the issue better
Best Regards
Hemanth
- Mark as New
- Bookmark
- Subscribe
- Mute
- Subscribe to RSS Feed
- Permalink
- Report Inappropriate Content
When is the next expected release?
- Mark as New
- Bookmark
- Subscribe
- Mute
- Subscribe to RSS Feed
- Permalink
- Report Inappropriate Content
While I can't comment on our upcoming release dates - but you can expect it very soon.
- Mark as New
- Bookmark
- Subscribe
- Mute
- Subscribe to RSS Feed
- Permalink
- Report Inappropriate Content
At ARDECO, we pride ourselves on our standards and ability to fulfill orders across the world. We create various custom umbrellas for companies worldwide.| Visit now.
- Mark as New
- Bookmark
- Subscribe
- Mute
- Subscribe to RSS Feed
- Permalink
- Report Inappropriate Content
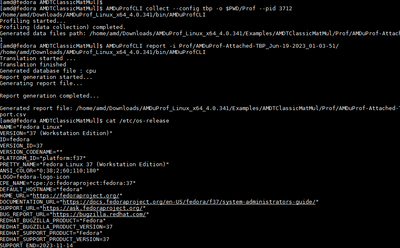
Hello
We were unable to reproduce the issue reported on Fedora 37.
Please find the steps as a reference
- Download AMDuProf(AMDuProf_Linux_x64_4.0.341.tar.bz2) from https://www.amd.com/en/developer/uprof.html#downloads accept the license
- Untar the tar file and locate the binaries AMDuProf and AMDuProfCLI
- Make sure the user has the privileges to profile the required process
For CLI:
- Run the program that you want to profile with the debugging option "-g". Get the pid of the program
- Command used for attaching to a process
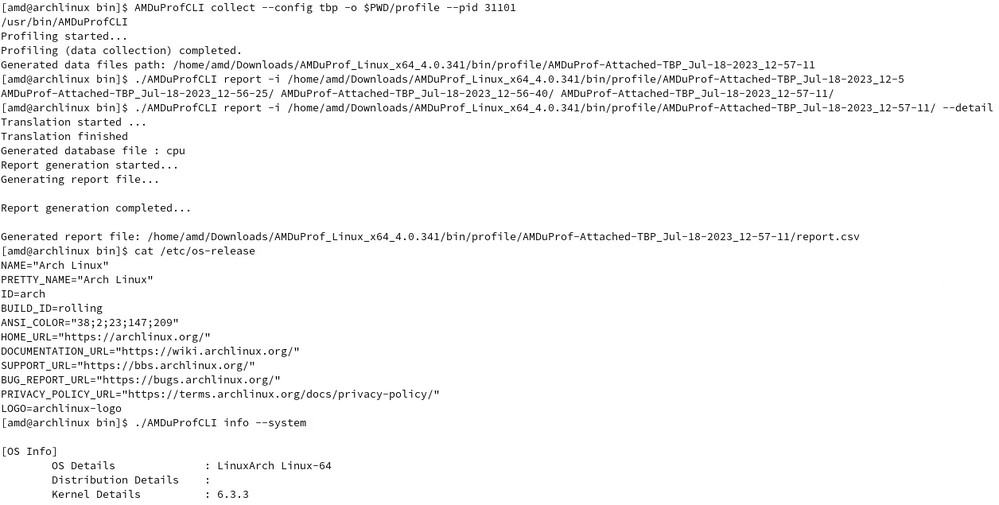
AMDuProfCLI collect --config tbp -o <o/p-dir> --pid <pid> - To generate a report
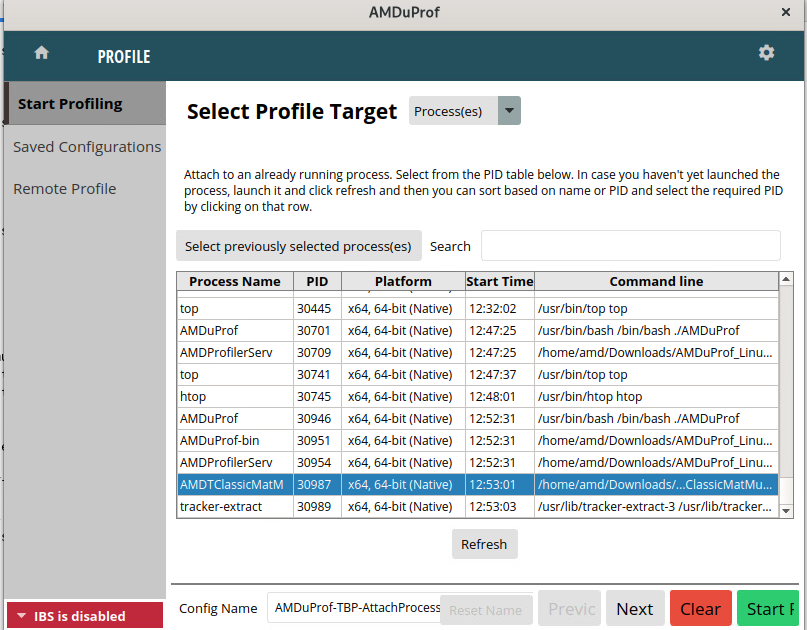
AMDuProfCLI report -i <o/p-dir> - I have tried with MatMul eample located in Examples/AMDTClassicMatMul which comes along with AMDuProf package
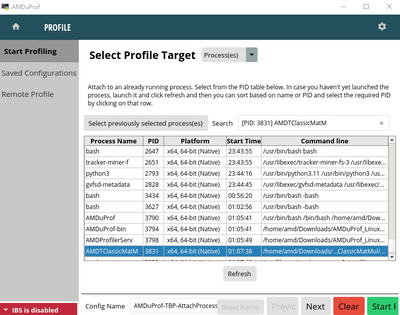
To view the same in GUI
- Launch the run and Open AMDuProf
- Select "Profile Running process"
- Look out for the process or search for it in the search bar and select it
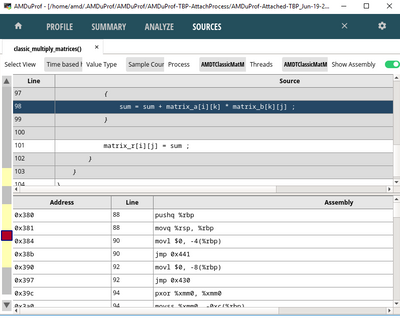
If you want to add any other setting like call stack openmpi trace select Next and select the required options.{optional} - Click on start profile and AMDuProf profiles the process selected
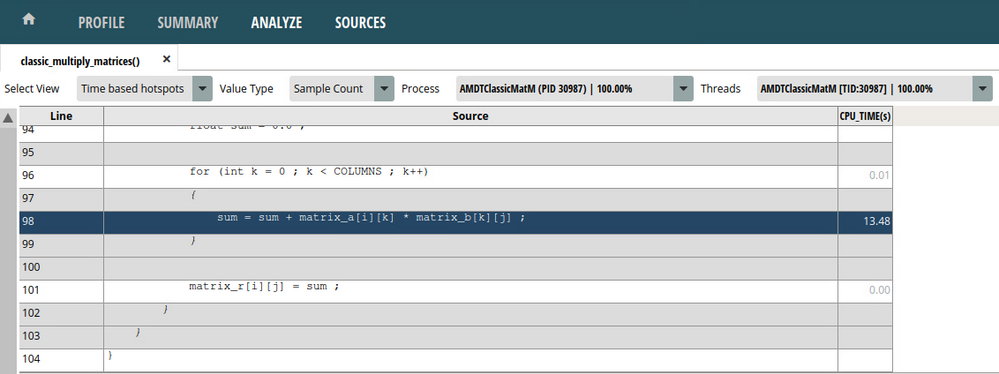
Please find the screenshots in reference to it and feel free to reach out for further queries
- Mark as New
- Bookmark
- Subscribe
- Mute
- Subscribe to RSS Feed
- Permalink
- Report Inappropriate Content
Any updates? Am seeing the same issue on archlinux, Threadripper 2950x.
/opt/amduprof/bin/AMDuProfCLI
[OS Info]
OS Details : LinuxArch Linux-64
Distribution Details :
Kernel Details : 6.3.9
[CPU Info]
AMD Cpu : Yes
Family : 0x17
Model : 0x08
Stepping : 0x2
Local APIC : Yes
Socket Count : 4
SMT Enabled : Yes
Threads per Core : 2
Threads per CCX : 8
Threads per Package : 32
Total number of Threads : 128
[PERF Features Availability]
Core PMC : Yes
L3 PMC : Yes
DF PMC : Yes
PERF TS : No
[IBS Features Availability]
IBS : No
[RAPL/CEF Features Availability]
RAPL : Yes
APERF & MPERF : Yes
Read Only APERF & MPERF : Yes
IRPERF : Yes
HW P-State Control : Yes
[PERF features supported by OS]
TBP Supported : Yes
EBP Supported : Yes
IBS Supported : No
IRPERF Supported : Yes
APERF Supported : Yes
MPERF Supported : Yes
BPF Supported : No
BCC Installed : No
Perf Event Paranoid : 0
Perf Event Max Mlock : 516 KB
Perf Event Max Stack : 127
[Hypervisor Info]
Hypervisor Enabled : No- Mark as New
- Bookmark
- Subscribe
- Mute
- Subscribe to RSS Feed
- Permalink
- Report Inappropriate Content
Hello tendiemonster
AMDuProf does not officially support Arch Linux OS.
Please find the supported OS here in the Operating Systems section
(https://www.amd.com/en/developer/uprof.html)
Even though I have tried to reproduce the issue at my end , but i couldn't.
I have tried with AMDTClassicMatMul example provided with AMDuProf package. I was able to attach to it from both CLI and GUI
Please find attached the screenshots of the same.
- Mark as New
- Bookmark
- Subscribe
- Mute
- Subscribe to RSS Feed
- Permalink
- Report Inappropriate Content
New release still has the same issue.

