Archives Discussions
- AMD Community
- Communities
- Developers
- Devgurus Archives
- Archives Discussions
- Re: Profiling opencl high level libraries like vex...
- Subscribe to RSS Feed
- Mark Topic as New
- Mark Topic as Read
- Float this Topic for Current User
- Bookmark
- Subscribe
- Mute
- Printer Friendly Page
- Mark as New
- Bookmark
- Subscribe
- Mute
- Subscribe to RSS Feed
- Permalink
- Report Inappropriate Content
Profiling opencl high level libraries like vexCL
Most high level opencl libraries generate the opencl kernel at runtime.
but i'm wondering how you can profile these libraries.
the libraries i'm talking about are boost.compute, vexCL , viennaCL.
CodeXL cannot detect the gpu part of the program since it isn't generated yet.
So gpu profiling and timetrace profiling is not possible.
I am using linux mint if this can help.
- Mark as New
- Bookmark
- Subscribe
- Mute
- Subscribe to RSS Feed
- Permalink
- Report Inappropriate Content
Hi boris,
CodeXL should be able to detect and profile any kernels dispatched to an AMD GPU or APU device using the AMD OpenCL platform. I've asked CodeXL QA to investigate whether there are any issues with applications that use the libraries you mentioned.
Thanks,
Chris
- Mark as New
- Bookmark
- Subscribe
- Mute
- Subscribe to RSS Feed
- Permalink
- Report Inappropriate Content
I have tried to profile the code but codeXL just refuses to profile.
-if i try the time based profiling then the program doesn't load.
-if i set the profiler to profile for the gpu it tells me that the program doesn't use openCL.
-if i attach to the program then no samples will be made at all.
i have attached a very simple example program
- Mark as New
- Bookmark
- Subscribe
- Mute
- Subscribe to RSS Feed
- Permalink
- Report Inappropriate Content
Have you any news on the CodeXL QA investigate?
I have been able to do some optimizations with the statical analysis and following the optimization but this only gets me so far.
- Mark as New
- Bookmark
- Subscribe
- Mute
- Subscribe to RSS Feed
- Permalink
- Report Inappropriate Content
I have been able improve the performance further by improving my memory access pattern. But i tried using codeXL 1.7 but i still can't profile the program.
My research paper is already written so will not need it anymore. But it just seems a bit sad that i never got any other response than this one.
It would still be a very good idea to support profiling of this library because it is very easy to use and high per formant.
- Mark as New
- Bookmark
- Subscribe
- Mute
- Subscribe to RSS Feed
- Permalink
- Report Inappropriate Content
Hi Boris,
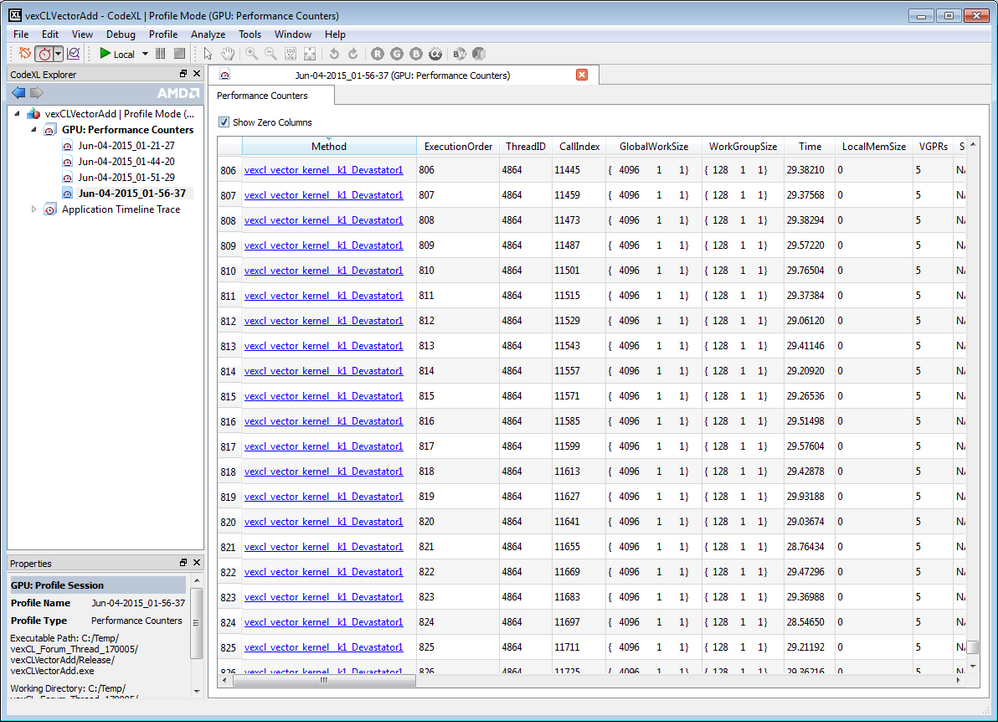
I can profile the sample you provided above on my Trinity + Devastator laptop with Windows 7-64bit, Boost 1.55, CodeXL 1.7, APP SDK 3.0-beta and vexCL source files downloaded from GitHub on Jun-3. See screenshot below.
Note: I reduced the number of times the multiplication loop is executed to keep the sample runtime shorter. I noticed that when the number of iterations increases, it takes much longer for the results to appear in CodeXL, although all kernel executions have already been completed.
I will investigate further.
Doron
- Mark as New
- Bookmark
- Subscribe
- Mute
- Subscribe to RSS Feed
- Permalink
- Report Inappropriate Content
Forgot to mention I built the sample with Visual Studio 2013 Professional
- Mark as New
- Bookmark
- Subscribe
- Mute
- Subscribe to RSS Feed
- Permalink
- Report Inappropriate Content
I am testing using linux mint (its just ubuntu with a different window manager) so maybe the problem is there. I can test it on window. But my full program only runs linux becasue it uses ROS.
the error i get when i try to run my own demo which i posted here is :
"Unable to gather profile data. This error can occur for one of several reasons:"
and then it says that my program does not contain a kernel or is not opencl/directcompute based.
i also use codeXL 1.7 and the 3.0 beta SDK. i compiled it with Clang (LLVM).
- Mark as New
- Bookmark
- Subscribe
- Mute
- Subscribe to RSS Feed
- Permalink
- Report Inappropriate Content
Hi Boris,
I built your sample on Linux Mint with gcc. I tried to profile with CodeXL and got the same pop-up message that you saw "Unable to gather profile data. This error can occur for one of several reasons:..."
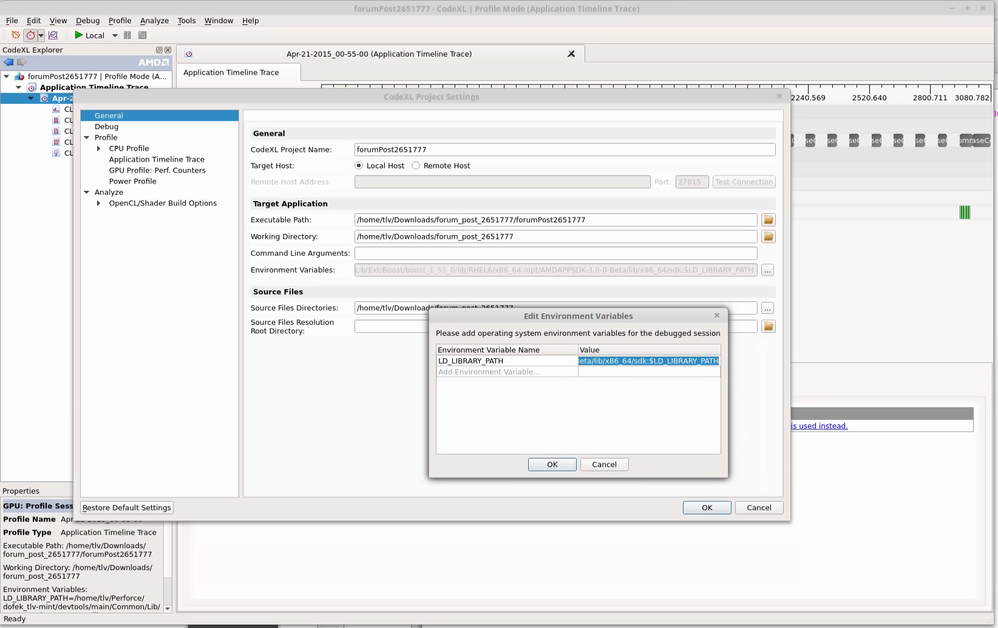
This confused me because the application ran well from the terminal, but then I remembered that before running from the terminal I set LD_LIBRARY_PATH to include the locations of the Boost binaries and the APP SDK binaries. So I updated the CodeXL project settings to set the LD_LIBRARY_PATH environment variable so it includes these paths similar to this value:
My_path_to_boost_binaries:/opt/AMDAPPSDK-3.0-0-Beta/lib/x86_64/sdk:$LD_LIBRARY_PATH
See also the screenshot below.
I started another profile session and this time I got profile results successfully.
Note: I reduced the number of iterations in the loop that performs multiplications to shorten the session.
Please let me know if this helps.
Doron
- Mark as New
- Bookmark
- Subscribe
- Mute
- Subscribe to RSS Feed
- Permalink
- Report Inappropriate Content
Thank you it works for the test application.
But sadly not for the full application because of the libraries i use (i.e. robot os, ROS) and it would be a too big of a hassle to save data and then load it into a profiling application.
But i'm happy that i could atleast profile some code.


