Archives Discussions
- AMD Community
- Communities
- Developers
- Devgurus Archives
- Archives Discussions
- Re: Buffer copy inside device - is it real times?
- Subscribe to RSS Feed
- Mark Topic as New
- Mark Topic as Read
- Float this Topic for Current User
- Bookmark
- Subscribe
- Mute
- Printer Friendly Page
- Mark as New
- Bookmark
- Subscribe
- Mute
- Subscribe to RSS Feed
- Permalink
- Report Inappropriate Content
Buffer copy inside device - is it real times?
I'm trying to use CodeXL instead of Code Analyst and see at least some issues that were with CadeAnalyst as well
1) CodeXL can't catch GPU API trace for my app. Tested on 2 different hosts. Only when "write every 100ms" enabled I can get anything back.
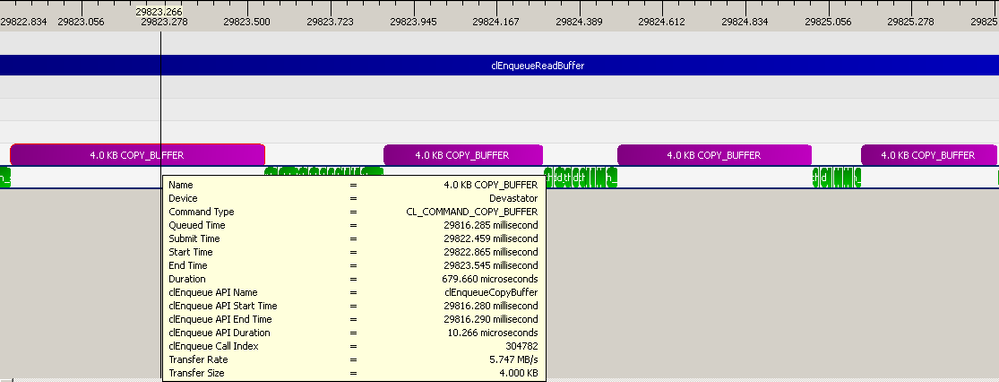
2) Please look on picture. buffer copied inside GPU memory. 4kb buffer. Buf why so different and so big times ?
Are these times real or I getting some artefacts here? Would it be better to use some copy kernel instead CopyBuffer call for these 4k of data?
EDIT:
Need to add that in another area of profiling timeline (same algorithm, same run, just different iteration) I got MUCH better times like 9-10us. And in other - even much more bad times like >1ms ![]() . Same 4kb buffer copied, just another iteration.
. Same 4kb buffer copied, just another iteration.
Also, that buffer was recreated from iteration to iteration (app uses quite different processing in different stages so bufer re-allocation required to decrease memory footprint). Can it be that for some of iterations Buffer was so badly misplaces that time were orders ![]() of magnitude worse? Or it's just some artefacts ? If so, how to avoid them ?
of magnitude worse? Or it's just some artefacts ? If so, how to avoid them ?
- Mark as New
- Bookmark
- Subscribe
- Mute
- Subscribe to RSS Feed
- Permalink
- Report Inappropriate Content
Is this forum appropriate place for such questions?
I posted here instead OpenCL forum cause not sure that data CodeXL provided are real. 1ms for 4kb transfer is too long it seems (especially if some readings only 9us length on same hardware).
Driver used is Catalyst 12.8.
CodeXL 1.1
- Mark as New
- Bookmark
- Subscribe
- Mute
- Subscribe to RSS Feed
- Permalink
- Report Inappropriate Content
Any chance to get some comments on this issue?
timings from >1ms to 9us for similar 4kb buffer copy looks little strange to take it as is...
- Mark as New
- Bookmark
- Subscribe
- Mute
- Subscribe to RSS Feed
- Permalink
- Report Inappropriate Content
CodeXL saves API trace results in DLL detach to minimize profiling overhead. If the program doesn't exit cleanly, you won't get any trace result. "Flush every x ms" option is used to handle the scenario if program doesn't exit cleanly but this mode has slightly higher overhead.
As for your device-device buffer question, are you saying some iterations have higher transfer time while some have low transfer time? Does the transfer gradually decrease or the transfer time changes from iteration to iteration?
- Mark as New
- Bookmark
- Subscribe
- Mute
- Subscribe to RSS Feed
- Permalink
- Report Inappropriate Content
Thanks for answer.
Regarding no data issue - yes, I circumvent it adding exit(0) right after part of code that interests me.
Well, my first post was based on observation of whole program run with "write each 100ms" enabled.
There buffder was reallocated from iteration to iteration. And yes, I checked few different places - looks like on iterations near beging of execution copy times were exceptionally big (>1ms), at the end of program they were much better, like ~9us.
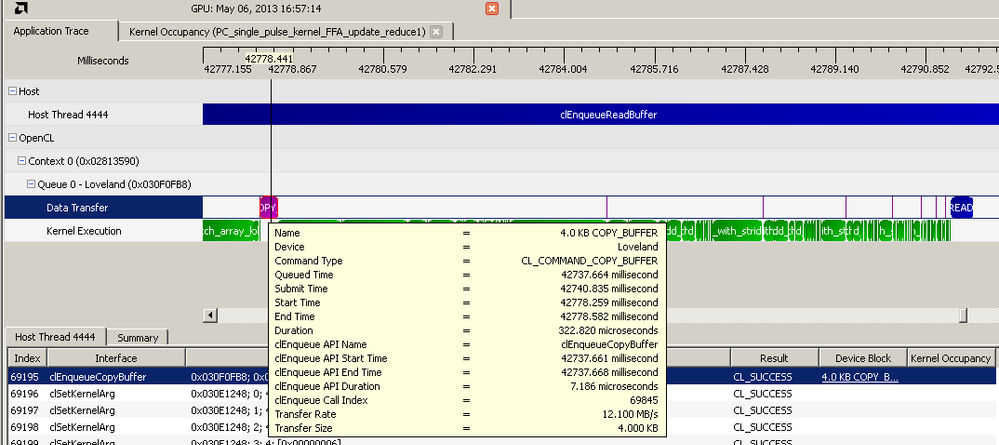
Screenshot i posted from something in the middle. But most probably it's some artefact (and would be good if this would be somehow fixed in new releases and some instructions were given how to avoid it now). Why? : because now I added exit(0) after first of those "iterations" (with buffer recreation) and profile w/o "write each 100ms" option only single iteration (need to say also i do this on different hardware, C-60, Win7x64). On this hardware (but it's APU too, just not A-10 but C-60) same picture looks completely different! Same algorithm, same data but look how different copy time vs kernel run time in between (compare with first picture)
As you can see much more adequate times than in first picture. almost all near 16us. But, not all so good. In initial there are 2 copies, both 4k, both in GPU memory, one by one. As you can see second in many times longer, 323us instead of 16us. And this repeated on each such cycle where 2 copies needed instead of one.
Why so? Is it real time or some artefact again? What hardware pecularity would explain this if this is not artefact?
- Mark as New
- Bookmark
- Subscribe
- Mute
- Subscribe to RSS Feed
- Permalink
- Report Inappropriate Content
Profiler uses timestamps from OpenCL runtime. OpenCL runtime launches a kernel to do GPU-GPU data transfer. A lot of factors could affect the GPU memory system - access pattern, caching and etc.


