cancel
Showing results for 
Search instead for 
Did you mean: 

Archives Discussions

maxdz8
Elite

Insufficient memory windows error when profiling (1.6.7249.0)

This used to appear when I try to profile my program up to a couple of days ago.

The program runs fine if not profiling. It really works fine if I just ignore the message.

Today I made some modifications resulting in a longer stream of commands and I cannot profile it anymore. The low memory errors now appears as previously but my program will just crash.

I have noticed codexl is reported as an 32-bit app in the task manager. I am using ~350MiB of VRAM and I've seen the memory usage spike at over 2 GiBs while running my program. My program is 64-bit. I see there's a sprofile.exe in the codexl\x64 directory. I have no idea which profiler is getting used but I cannot avoid asking myself if the things are related.

As a side note: this project was originally 32 bit.

Advice appreciated.

0 Likes
1 Solution
dorono
Staff

Hi,

CodeXL automatically uses the correct SProfile variant for the appropriate architecture, either 32 or 64 bit.

To avoid disk IO during the profile session, the profiler stores its results in memory by default, and dumps to disk only when the profile session ends. For the common case this is fine. However, the profiler can be configured to periodically dump its collected data instead of accumulating it in memory:

Use the Application Timeline Trace node on the CodeXL Project Settings dialog, and check the "Write trace data in intervals during program execution (ms)" option. Leave the interval at 100ms which is the default value.

See the screenshot below.
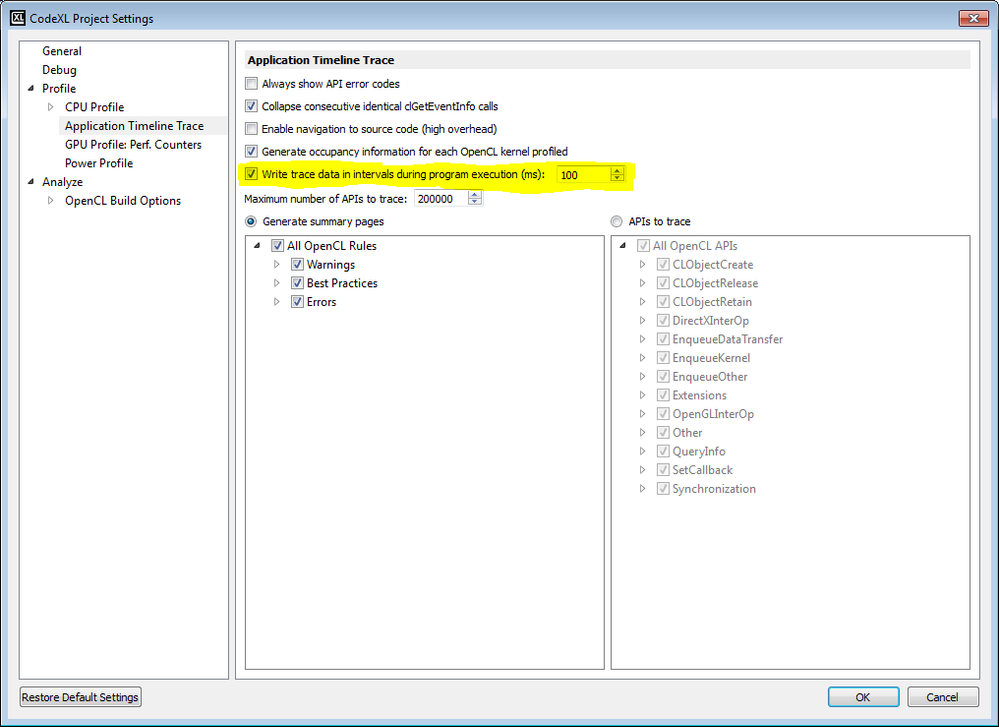
CodeXL_Project_Settings_Periodic_Dump_highlighted.PNG.png

View solution in original post

0 Likes
1 Reply
dorono
Staff

Hi,

CodeXL automatically uses the correct SProfile variant for the appropriate architecture, either 32 or 64 bit.

To avoid disk IO during the profile session, the profiler stores its results in memory by default, and dumps to disk only when the profile session ends. For the common case this is fine. However, the profiler can be configured to periodically dump its collected data instead of accumulating it in memory:

Use the Application Timeline Trace node on the CodeXL Project Settings dialog, and check the "Write trace data in intervals during program execution (ms)" option. Leave the interval at 100ms which is the default value.

See the screenshot below.

CodeXL_Project_Settings_Periodic_Dump_highlighted.PNG.png

0 Likes