We have a DirectCompute shader that is running extremely slow and are trying to determine the cause. We cannot use OpenCL because the target is a Windows Store application, which will not pass certification if it links to OpenCL.
We've tried the following:
1. Profile OpenCL implementation then back-port to DirectCompute. Unfortunately the OpenCL implementation version runs perfectly fast, but runs slowly once back-ported to DirectCompute. We suspect this is due to the DirectCompute FXC compiler poorly optimizing the generates IL bytecode, but have no profiling tools available to be sure.
2. Examine the produced DirectCompute IL output. It appears the produced DirectCompute IL may be using too many temporary registers (VGPRs in AMD parlance), but we have not found a way to determine how the AMD driver is translating the DirectCompute IL to AMD IL or device specific byte code. The AMD driver may be optimizing out some of the temporary registers or there may be some other performance issue.
3. We've also tried specifying D3D11_CREATE_DEVICE_DEBUGGABLE to D3D11CreateDevice (which is documented to enable performance counters), however doing so causes D3D11CreateDevice to fail with DXGI_ERROR_UNSUPPORTED on AMD platforms.
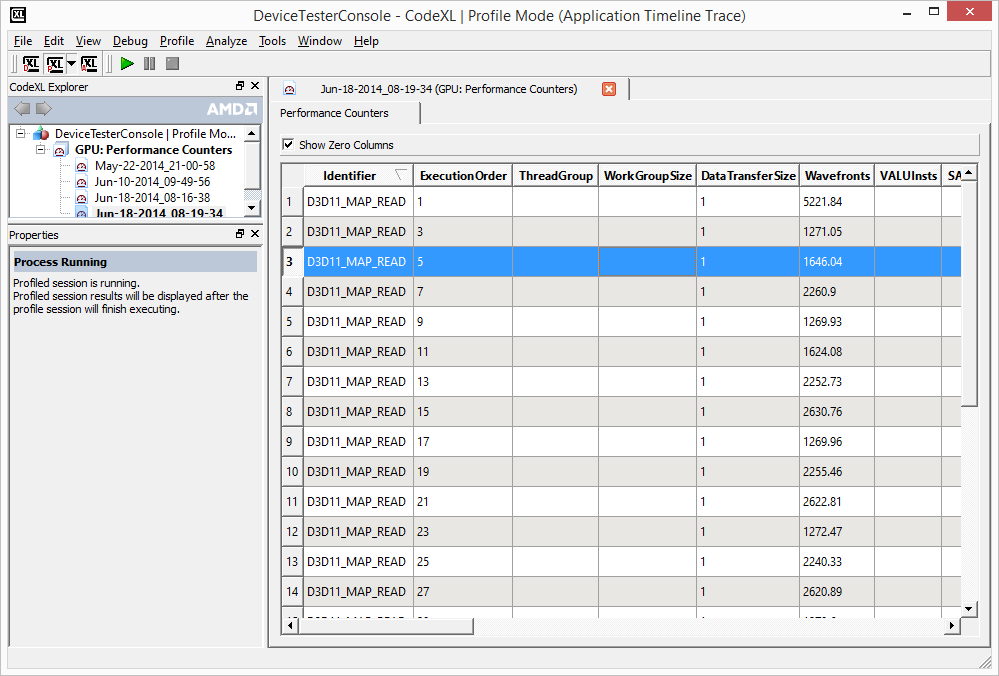
Net: We need some way to either profile the DirectCompute shader to see VGPR, SGPR, and other occupancy telemetry, OR some way to examine the final AMD IL or device specific byte code.
Please help, thank you!
Our platform is:
Windows 8.1 64bit w/ Update
Radeon R9 290
CodeXL 1.4.5724.0
APP SDK 2.9
Visual Studio Ultimate 2013 Update 2
AMD Catalyst Version: 13.12
Driver Packaging Version: 13.251-131206a-166151E-ATI
EDIT: Attached is an image showing the limited CodeXL DirectCompute profiling output:
