Turn on suggestions
Auto-suggest helps you quickly narrow down your search results by suggesting possible matches as you type.
Showing results for
Archives Discussions
- AMD Community
- Communities
- Developers
- Devgurus Archives
- Archives Discussions
- Get peak performance at Radeon 5870
Options
- Subscribe to RSS Feed
- Mark Topic as New
- Mark Topic as Read
- Float this Topic for Current User
- Bookmark
- Subscribe
- Mute
- Printer Friendly Page
- Mark as New
- Bookmark
- Subscribe
- Mute
- Subscribe to RSS Feed
- Permalink
- Report Inappropriate Content
02-04-2014
11:01 AM
Get peak performance at Radeon 5870
Hi guys,
I am new in this forum und I have to admit that I am not a very experienced programmer in terms of gpu programming. Nonetheless I want to write some code to achieve peak performance (tflop/s) of my radeon 5870 (which is 2.72 TFlops). Getting an easy start, I downloaded "FlopsCL" from Kamil Rocki (see http://olab.is.s.u-tokyo.ac.jp/~kamil.rocki/FlopsCL_src_linux.zip).
Running the benchmark tool I got 2.15 TFlops (using float4). Thats impressive but by far not peak performance. Thus, I fired up CodeXL / AMD AppAnalyzer. The results:
KernelOccupancy = 100
ALUBusy = 49.84%
ALUPacking = 79.93%
How can I optimize the kernel code to get full peak performance? Above all, is 'peak performance' reachable, even in a synthetic test - or is this just a calculated number based on tech details? How can I get better ALUPacking (obviously there are only 4 ALUs utilized of the VLIW5-ALUs)?
Regards
Marcus
5 Replies
- Mark as New
- Bookmark
- Subscribe
- Mute
- Subscribe to RSS Feed
- Permalink
- Report Inappropriate Content
02-04-2014
11:42 PM
You could try this as well and see how it performs:
http://parallelplusplus.blogspot.gr/2014/01/benchmarking-capabilities-of-your_28.html
- Mark as New
- Bookmark
- Subscribe
- Mute
- Subscribe to RSS Feed
- Permalink
- Report Inappropriate Content
02-05-2014
12:48 AM
(4/5)*2.72 = 2.176. You are reaching 2.15TFLOPs. All is well!
VLIW5 can sure pack 5 operations together. But can all 5 be floating point math? You may need to check what are the arithmetic units that can be fed by VLIW5?
If the fifth module is a non-arithmetic stuff (like say Shifter or something like that), you really cant get MAD (Mul-add) flops using that.
For all calculatations, I used to assume 2.2TF as peak on 5870-- iirc.
The GCN Architecture whitepaper shows how graphics developed over various eras. In that PDF, VLIW5 is represented as 4 stream processors + 1 (FMAD + Special functions).
Special functions could mean sin/cos/tan functions. FMAD could be Fused multiply-add. I am not too sure though....
HTH
Best,
Bruhaspati
- Mark as New
- Bookmark
- Subscribe
- Mute
- Subscribe to RSS Feed
- Permalink
- Report Inappropriate Content
02-05-2014
09:56 AM
Hi guys, thanks for your input so far.
> You could try this as well and see how it performs:
> http://parallelplusplus.blogspot.gr/2014/01/benchmarking-capabilities-of-your_28.html
I gave this benchmark a try recently... and got 2.1 tflops as well.
> VLIW5 can sure pack 5 operations together. But can all 5 be floating point math? You may need to check what are the arithmetic units that can be fed by VLIW5?
> If the fifth module is a non-arithmetic stuff (like say Shifter or something like that), you really cant get MAD (Mul-add) flops using that.
> For all calculatations, I used to assume 2.2TF as peak on 5870-- iirc.
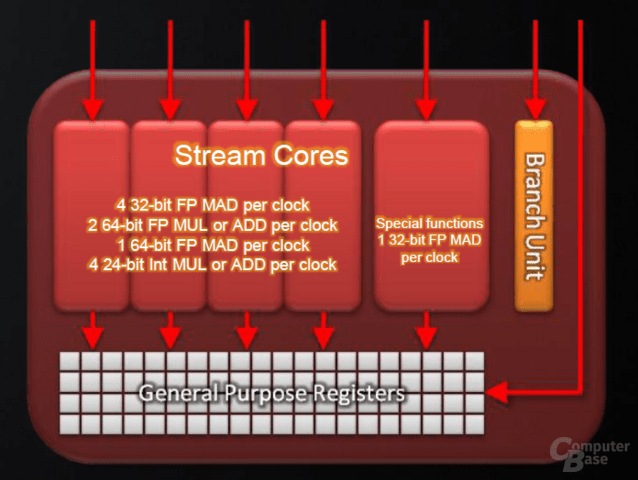
I think the 5D-ALU architecture can handle 5 MAD-Operations per cycle. There are 4 simple ALUs + 1 big ALU (see this pic here http://pics.computerbase.de/2/6/9/3/9/147_m.png - so calculating 5 32-bit floats in parallel shouldn't be a problem). I think those benchmark programs can't utilize the 5th ALU because of 'dependencies' of the instructions. This conforms to a ALUPack of 80% as stated by AMD Profiler. Taking a closer look at the benchmark kernel (see my initial posting for source reference), I think while dealing with 2 float4 you can never fully load 5 ALUs but 4 ALUs. Can anybody confirm this thought?
Excerpt of the benchmarking kernel (in pseudo code):
[...]
float4 a;
float 4b;
very long (unrolled) loop {
a = b * a + b; // fused multiply add of two float4
b = a * b + a; // fused multiply add of two float4
| } |
[...]
Finally, can anybody give me some hints how to write a kernel for benchmarking which utilizes all 5 ALUs?
Regards
Marcus
- Mark as New
- Bookmark
- Subscribe
- Mute
- Subscribe to RSS Feed
- Permalink
- Report Inappropriate Content
02-22-2014
02:42 AM
Hi guys,
meanwhile I got 2.64 TFlops. I consider this as 'peak performance' (side note: theoretical peak performance (TFlop/s) of my radeon 5870 is 2.72 TFlops).
This is what my kernel looks like:
__kernel void sum_float4_vliw5(__global double* const dA, __global double* dResult) {
const size_t bx = get_group_id(0);
const size_t tx = get_local_id(0);
const unsigned pIndex = 256 * bx + tx;
float4 a = (float4)(dA[tx], dA[tx], dA[tx], dA[tx]);
float4 b = (float4)(1.01f, 1.02f, 1.03f, 1.04f);
float c = dA[tx];
float d = 1.02f;
for (unsigned i = 0; i < 600; i++) {
a = b * a + b;
b = a * b + a;
c = d * c + d;
d = c * d + c;
}
dResult[pIndex] = a.s0 + b.s0 + a.s1 + b.s1 + a.s2 + b.s2 + a.s3 + b.s3 + c + d;
}
Taking a look at the generated ISA code, I can confirm that all ALUs (x,y,z,w and t) are used. This perfectly fits a ALUPacking of 97.79%, as stated by the performance counters.
Here is an excerpt of my performance counter statistics:
Kernel Occupancy: 100%
ALUBusy: 49.77%
ALUPacking: 97.79%
Nonetheless I don't understand 'ALUBusy'. Why don't I see a value close to 100%? Why is it just 49.77%? Regarding ALUBusy, there is a hint stating 'The percentage of GPUTime ALU instructions are processed'. As long as my kernel reaches peak performance and there are no memory fetches why aren't all ALUs 100% of time executing instructions? I am confused...
Regards
Marcus
- Mark as New
- Bookmark
- Subscribe
- Mute
- Subscribe to RSS Feed
- Permalink
- Report Inappropriate Content
06-09-2014
04:31 AM
Hi,
ALUBusy performance counter shows the percentage of time GPU executes ALU instructions. A low count of ALUBusy means that there are no active wave-fronts to hide memory latency and GPU remains idle and waits for data from the memory.
