Hi all,
I download and test gDEBugger, and I encounter some issues.
My test environment :
GPU : AMD HD 7750
GPU Driver : AMD Catalyst 12.6 Proprietary Linux x86 Display Driver (amd-driver-installer-12-6-x86.x86_64.run)
CPU : Intel(R) Core(TM) i5 CPU 760 @ 2.80GHz
AMDAPP SDK v2.7
Before test, I rebuild all cl samples in AMDAPP SDK with Debug config.
---------------------------------------
Issue 1 :
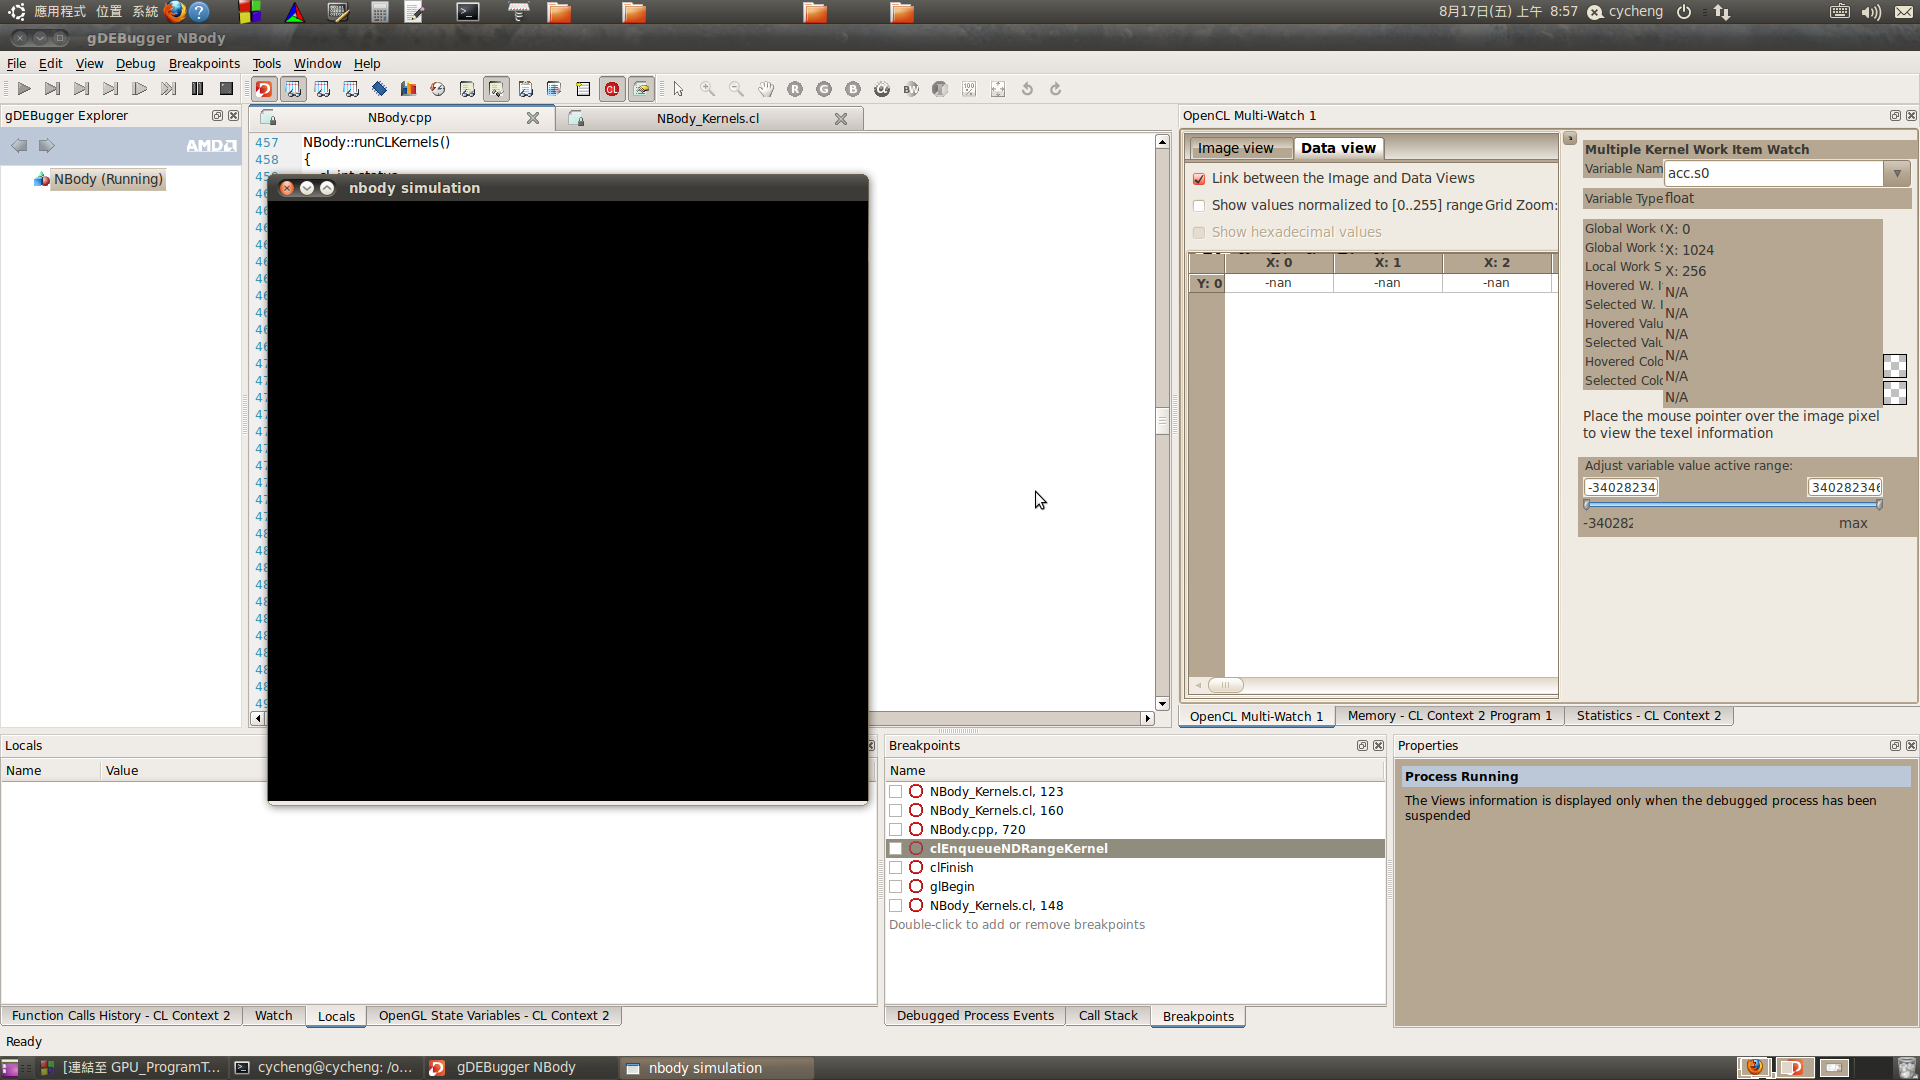
When debug OpenCL Kernel, I break at "barrier(CLK_LOCAL_MEM_FENCE);" and it will cause wrong calculation result !
I use NBody sample to do test.
Ref. Feedback-NBody-Error.png
You could see variable "acc" becomes {-nan, -nan, ...} after first iteration.
The render result showed at Feedback-NBody-Error2.png
I don't know if it is hardware or software problem ?
---------------------------------------
Issue 2 :
I easily hanged when I open "OpenCL Multi-Watch" or "CL Context # CL Buffer #" view
Ref. Feedback-HangedCase-1.png
---------------------------------------
Issue 3 :
As you can see in previous figure, the "Multiple Kernel Work Item Watch" panel is not well formed
---------------------------------------
Issue 4 :
I can not debug the sample "AMDTTeaPot" at first, I have to rebuild AMDTTeaPot & AMDTTeaPotLib then I can just debug them.
By the way, in order to success debug AMDTTeaPot, I have to clear any breakpoint first, when AMDTTeaPot is running, interrupt it by set breakpoints, if I do not follow the step, I will encounter segmentation fault.
Ref. Feedback-AMDTTeaPot.png
Thanks for your time !
Cycheng
