Archives Discussions
- AMD Community
- Communities
- Developers
- Devgurus Archives
- Archives Discussions
- Re: Sharp increase in CPU usage by AMD driver if n...
- Subscribe to RSS Feed
- Mark Topic as New
- Mark Topic as Read
- Float this Topic for Current User
- Bookmark
- Subscribe
- Mute
- Printer Friendly Page
- Mark as New
- Bookmark
- Subscribe
- Mute
- Subscribe to RSS Feed
- Permalink
- Report Inappropriate Content
Sharp increase in CPU usage by AMD driver if number of sync points decreased - how to avoid?
Recently I changed algorithm in app to keep more data directly on GPU that caused considerable decrease in number of buffer mapping (and each buffer mapping was sync point also).
I expected improve in run time due to increased GPU load and decrease in CPU time also due to less work for CPU to do.
But almost all what I got is sharp increase in CPU time. If before change CPU time constituted only small part of elapsed time, now CPU time almost equal elapsed. That is, almost 100% of CPU usage during whole app run.
I tried to avoid such CPU usage putting working thread into sleep before sync points - no success. While logs show that app reads event and sleep until it get corresponding status, CPU time not decreased.
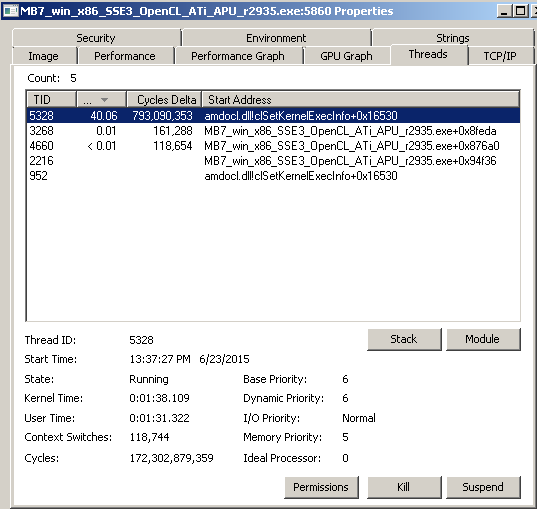
So, I used ProcessExplorer to find who is consuming CPU. It was AMD driver thread with next stack:
KERNELBASE.dll!WaitForSingleObjectEx+0x98
kernel32.dll!WaitForSingleObjectEx+0x43
kernel32.dll!WaitForSingleObject+0x12
amdocl.dll!oclGetAsic+0x511eb
amdocl.dll!oclGetAsic+0x4883d
amdocl.dll!oclGetAsic+0x678fc
amdocl.dll!oclGetAsic+0x675d9
amdocl.dll!oclGetAsic+0x612a9
amdocl.dll!oclGetAsic+0x48560
amdocl.dll!oclGetAsic+0x40dc2
amdocl.dll!oclGetAsic+0x3fd49
amdocl.dll!oclGetAsic+0x3a677
amdocl.dll!oclGetAsic+0x313e
amdocl.dll!oclGetAsic+0x3326
amdocl.dll!clSetKernelExecInfo+0x57c8f
amdocl.dll!clSetKernelExecInfo+0x4bd67
amdocl.dll!clSetKernelExecInfo+0x3087b
amdocl.dll!clSetKernelExecInfo+0x5628
amdocl.dll!clSetKernelExecInfo+0x56c6
amdocl.dll!clSetKernelExecInfo+0x143d
amdocl.dll!clSetKernelExecInfo+0x1656c
kernel32.dll!BaseThreadInitThunk+0x12
ntdll.dll!RtlInitializeExceptionChain+0x63
ntdll.dll!RtlInitializeExceptionChain+0x36
picture clearly shows that this thread is main CPU consumer for the app's process:
So the question is - how to avoid such behavior? It seems that w/o big number of sync points between GPU and host code AMD driver goes mad and starts to use whole CPU core for own needs.
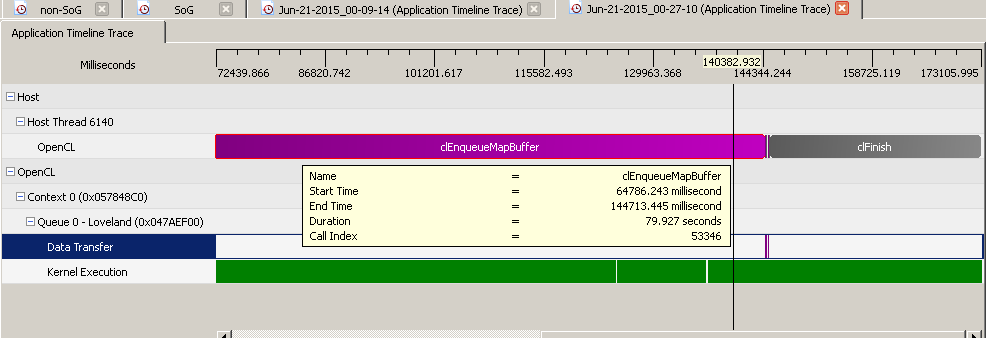
EDIT: Here are illustrations with CodeXL TimeLine pics how timeline looked before
after change
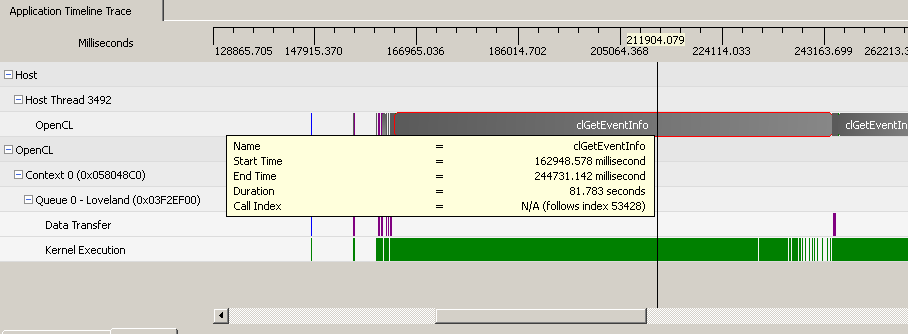
and with marker event and Sleep(1) loop until event reached
As one can see (profiling done on C-60 APU but discrete HD6950 under different drivers shows same CPU usage pattern) there is quite big time interval of ~80s where GPU works on its own w/o synching with host. And it's place where AMD driver starts to consume whole CPU core.
EDIT2: it's very similar to issue described here: Re: Cat13.4: How to avoid the high CPU load for GPU kernels? by .Bdot
Any new cures since 2013 year?..
- Mark as New
- Bookmark
- Subscribe
- Mute
- Subscribe to RSS Feed
- Permalink
- Report Inappropriate Content
Hi Raistmer,
I'm not sure about the issue. Need to check with the driver/runtime team. Could you please provide a reproducible test-case? Or may I take the test-case from here Re: Cat13.4: How to avoid the high CPU load for GPU kernels? , if still applicable to you? Please specify if I need any particular H/W or driver to reproduce the issue.
Regards,
- Mark as New
- Bookmark
- Subscribe
- Mute
- Subscribe to RSS Feed
- Permalink
- Report Inappropriate Content
Hi
Since post I implemented something similar to workaround mentioned in 2-years old thread, just more simple one - to put clFinish after each Nth algorithm iteration.
And it worked as expected:
WU : PG1327_v7.wu
MB7_win_x86_SSE3_OpenCL_ATi_APU_r2935.exe :
Elapsed 72.004 secs
CPU 68.360 secs
MB7_win_x86_SSE3_OpenCL_ATi_APU_r2935_non_SoG.exe :
Elapsed 72.868 secs
CPU 17.457 secs
MB7_win_x86_SSE3_OpenCL_ATi_APU_r2935_sync_iter.exe -sync_iter 1 :
Elapsed 73.258 secs
CPU 18.159 secs
MB7_win_x86_SSE3_OpenCL_ATi_APU_r2935_sync_iter.exe -sync_iter 2 :
Elapsed 73.070 secs
CPU 17.613 secs
MB7_win_x86_SSE3_OpenCL_ATi_APU_r2935_sync_iter.exe -sync_iter 3 :
Elapsed 73.071 secs
CPU 20.764 secs
MB7_win_x86_SSE3_OpenCL_ATi_APU_r2935_sync_iter.exe -sync_iter 4 :
Elapsed 73.086 secs
CPU 37.908 secs
MB7_win_x86_SSE3_OpenCL_ATi_APU_r2935_sync_iter.exe -sync_iter 5 :
Elapsed 72.977 secs
CPU 42.713 secs
As one can see, putting clFinish() after each 2 iterations (each iteration includes few kernels including FFT ones, so not just 1-2 kernels) CPU consumption returned to original one ("non_SoG" build).
But also, no any speedup for new build with such conditions.
So, my little test just validated the claim of old thread - if queue grows long enough driver starts to consume CPU in enormous quantities.
I think test case from old thread will demonstrate this just as good as my app.
And I tested this behavior also with Windows 10 x64 + AMD drivers it installed. I suppose it should be "latest available", right?
So, issues exists in latest AMD drivers.
- Mark as New
- Bookmark
- Subscribe
- Mute
- Subscribe to RSS Feed
- Permalink
- Report Inappropriate Content
As I ran that test-case, I got similar observation. However, the number of enqueued kernels and CPU percentage seem vary with the hardware configuration. Not sure whether there is any limitation or not. I'll check with driver team and if needed, file a bug report against this issue.
Thanks for pointing to the old thread.
Regards,
- Mark as New
- Bookmark
- Subscribe
- Mute
- Subscribe to RSS Feed
- Permalink
- Report Inappropriate Content
Update:
An internal bug report has been filed against this issue and the engg. team is working on it. Once I get any further update, I'll share with you.
- Mark as New
- Bookmark
- Subscribe
- Mute
- Subscribe to RSS Feed
- Permalink
- Report Inappropriate Content
Here is an update. As I've come to know, the issue has been resolved in the latest internal build. Hope, the fix will be available soon in the public version also.
Regards,
- Mark as New
- Bookmark
- Subscribe
- Mute
- Subscribe to RSS Feed
- Permalink
- Report Inappropriate Content
Have you tried doing a proper non-blocking read-back instead?
Possibly with event based sleep.
- Mark as New
- Bookmark
- Subscribe
- Mute
- Subscribe to RSS Feed
- Permalink
- Report Inappropriate Content
read-back of what? There is nothing to read back for 80s, there is long chain of kernels. And if chain gets long enough 100% CPU usage appears.
- Mark as New
- Bookmark
- Subscribe
- Mute
- Subscribe to RSS Feed
- Permalink
- Report Inappropriate Content
Read-back of the exact stuff you're waiting for now.
Except that instead of blocking on map or polling for event, you sleep on the event, possibly doing a flush (but never finish!).
Also keep in mind that some hw / drivers / OS combinations have issues with very long tasks. I have difficulty understanding how a properly written kernel can take 80s to run.
Those drivers/OS will trip a watchdog, kill the CL context. Events will become invalid and wait calls on them will error.
In my experience this shouldn't be happening on Win7, let alone 10 and since it is my understanding you're not waiting on event that shouldn't be happening.
But since I had the same symptom in the past, I'm interested in checking if there could be a connection.
- Mark as New
- Bookmark
- Subscribe
- Mute
- Subscribe to RSS Feed
- Permalink
- Report Inappropriate Content
Please look pics attached to initial post to better understand execution chain in question.
There is no 80s kernel, there is 80s chain of many kernels. And CPU load occurs long before any synching occured.
As i stated in initial post app worker thread put into sleep but driver thread uses CPU.
Considering actrually described situation instead of some other model one in answer will help a lot, thanks.
- Mark as New
- Bookmark
- Subscribe
- Mute
- Subscribe to RSS Feed
- Permalink
- Report Inappropriate Content
Another workaround for this issue (only "workaround" cause its implementation did not improved overall performance) is to use 2 queues for that chain of kernels and link them via events where needed. This way no blocking sync with host required, only some ordering on device. And nevertheless this decreased CPU consumption once more proving that excessive CPU usage some buggy condition in runtime/driver.
CPU time consumption dropped in this case to level only slightly above initial one (where blocking mapping of flags was used).
As I understand using 2 queues could allow kernels pairing on device that could improve performance in theory.
In reality I don't see any performance improvement on HD6950 GPU, unfortunately. Maybe results for GCN would differ?...


